
I just wanted to pass along some info on behalf of our pal Craig Tutterow who has been working hard on socilab, a cool new project which magically transforms your LinkedIn data into network-based social science. In addition to being able to analyze their data online, users can also download their data as a .csv file that can then be read in to their favorite network package. According to Craig, future incarnations will also include support for Pajek .net files and unicode names in .csv download. If you want more details, check out the announcement that recently went out to the SOCNET listserv. You can also look below the break for a working example.
Cluster Computing for $0.27/hr using Amazon EC2 and IPython Notebook
This is a guest post by Randy Zwitch (@randyzwitch), a digital analytics and predictive modeling consultant in the Greater Philadelphia area. Randy blogs regularly about Data Science and related technologies at http://randyzwitch.com.
A few months ago I passed the 10-year point in my analytics/predictive modeling career. While ‘Big Data’ and ‘Data Science’ have only become buzzwords in recent years, hitting the limit on computing resources has been something that has plagued me throughout my career. I’ve seen this problem manifest itself in many ways in all types of companies from sites where you can buy YouTube plays to large corporations. The problem ranges having analysts get assigned multiple computers for daily work, to continuously scraping together budget for more processors on a remote SAS server and spending millions on large enterprise databases just to get processing of data below a 24-hour window.
Luckily, advances in open source software & cloud computing have driven down the cost of data processing & analysis immensely. Using IPython Notebook along with Amazon EC2, you can now procure a 32-core, 60GB RAM virtual machine for roughly $0.27/hr (using a spot instance). This tutorial will show you how to setup a cluster instance at Amazon, install Python, setup IPython as a public notebook server and access this remote cluster via your local web browser.
To get started with this tutorial, you need to have an Amazon Web Services account. I also assume that you already have basic experience interacting with computers via the command line and know about IPython. Basically, that you are the average Bad Hessian reader…
Python and PyData Conferences Are Important for the Future of Social Science Research
This is a guest post by Karissa McKelvey. She has a BA in Computer Science and Political Science from Indiana University. After graduating, she worked as a research assistant at the Center for Complex Networks and Systems Research at Indiana University on an NSF grant to analyze and visualize the relationship between social media expressions and political events. She is an active contributor to open source projects and continues to publish in computer supported cooperative work and computational social science venues. She currently works as a Software Engineer at Continuum Analytics.
Imagine you are a graduate student of some social or behavioral science (not hard, I assume). You want to collect some data: say I’m going to study the fluctuation of value of products over time on Craiglist, or ping the Sunlight Foundation’s open government data, or use the GDELT to study violent political events. There are a variety of tools I may end up using for my workflow:
- Retrieving the data: Python, BeautifulSoup
- Storing the data: CSV, Json, MySQL, MongoDB, bash
- Retrieving this stored data: SQL, Hive, Hadoop, Python, Java
- Manipulating the data: Python, CSV, R
- Running regressions, simulations: R, Python, STATA, Java
- Presenting the data: R, Excel, Powerpoint, Word, LaTeX
My workflow for doing research now requires a variety of tools, some of which I might have never used before. The number of tools I use seems to scale with the amount of work I try to accomplish. When I encounter a problem in my analysis, or can’t reproduce some regression or simulation I ran, what happened? Where did it break?
Should it really be this difficult? Should I really have to learn 10 different tools to do data analysis on large datasets? We can look at the Big Data problem in a similar light as surveys and regression models. According to IT companies such as Mustard IT, the largest and most fundamental part of the equation is just that this stuff is new – high-priority and well thoughout workflows have yet to be fully developed and stablized.
What if I told you that you could do all of this with the fantastically large number of open source packages in Python? In your web browser, on your iPad?
Big Data and the Survival of the Scientific Method
This is a guest post by Jen Schradie. Jen is a doctoral candidate in the Department of Sociology at the University of California-Berkeley and the Berkeley Center for New Media. She has a master’s degree in sociology from UC Berkeley and a MPA from the Harvard Kennedy School. Using both statistical methods and qualitative fieldwork, her research is at the intersection of social media, social movements and social class. Her broad research agenda is to interrogate digital democracy claims in light of societal and structural differences. Before academia, she directed six documentary films on social movements confronting corporate power. You can find her at www.schradie.com or @schradie on Twitter.
Five years ago, Chris Anderson, editor-in-chief of Wired Magazine, wrote a provocative article entitled, “The End of Theory: The Data Deluge Makes the Scientific Method Obsolete” (2008). He argued that hypothesis testing is no longer necessary with google’s petabytes of data, which provides all of the answers to how society works. Correlation now “supercedes” causation:
This is a world where massive amounts of data and applied mathematics replace every other tool that might be brought to bear. Out with every theory of human behavior, from linguistics to sociology. Forget taxonomy, ontology, and psychology. Who knows why people do what they do? The point is they do it, and we can track and measure it with unprecedented fidelity. With enough data, the numbers speak for themselves.
An easy strawman, Anderson’s piece generated a host of articles in academic journals decrying his claim. The overall consensus, to no surprise, was that the scientific method – i.e. hypothesis testing – is far from over. Most argued as Pigliucci (2009:534) articulated,
But, if we stop looking for models and hypotheses, are we still really doing science? Science, unlike advertising, is not about finding patterns—although that is certainly part of the process—it is about finding explanations for those patterns.
Other analysts focused on the debate around “correlation is not causation.” Some critiqued Anderson in that correlation can lead you in the wrong direction with spurious noise. Others implicitly pointed to what Box (1976) articulated so well pre-Big Data – that science is an iterative process in which correlation is useful in that it can trigger research which uses hypothesis testing.
Hacking GDELT

This weekend, I made it out to Penn State to participate in the GDELT hackathon, sponsored by the Big Data Social Science IGERT and held in the punnily-named Databasement. The hackathon brought together a lot of different groups — political scientists, industry contractors, computer and information scientists, geographers, and — of course — sociologists (I was one of two).
GDELT, as you may remember, a political events database with nearly 225 million events from 1979 to the present. Hackathon attendees had interests ranging from optimizing and normalizing the database, predicting violent conflict, and improving event data in general.
What else does a data scientist need?
I’m a big fan of Drew Conway‘s Data Science Venn Diagram, in which he outlines the three intersecting spheres of skill that the data scientist needs — hacking skills, math and statistics knowledge, and substantive expertise. I’ve used this idiom in thinking through how to bring more sociologists into using computational methods. This has been a matter of getting them to learn how to hack or see the virtues of hacking even if they don’t have a taste for it themselves.
But what I think the diagram is missing — or it’s at least gets buried underneath the surface — is knowledge of the processes of data production. This is maybe a subtler point which I think gets looped in with “substantive expertise” but I want to draw this line out to be as explicit as possible because I think this is one of data science’s weaker flanks and one of the places where it needs to be strengthened to gain more acceptance within the social sciences.
Patterns in the Ivy II: Beyond the Giant Component
Last week’s post on the metal collaboration network brought attention largely to the “giant component”–the largest subgraph in a network where all actors have at least one path to all other actors. In large networks, even sparse ones, giant components typically emerge and include the majority of actors in the network. While focusing on the giant component follows conventional practice while analyzing small world networks, perhaps worthwhile information can be inferred from actors outside of the giant component.
(Craft) Brewing in the USA
A couple of months ago a friend directed me to a piece by the New Yorker which included a nice interactive map depicting the landscape of craft brewing in the United States based on data provided by the Brewer’s Association. Using this data, what can we say about the geography of craft brewing in the United States?
To get started, let’s look at the distribution of craft breweries at the state level:
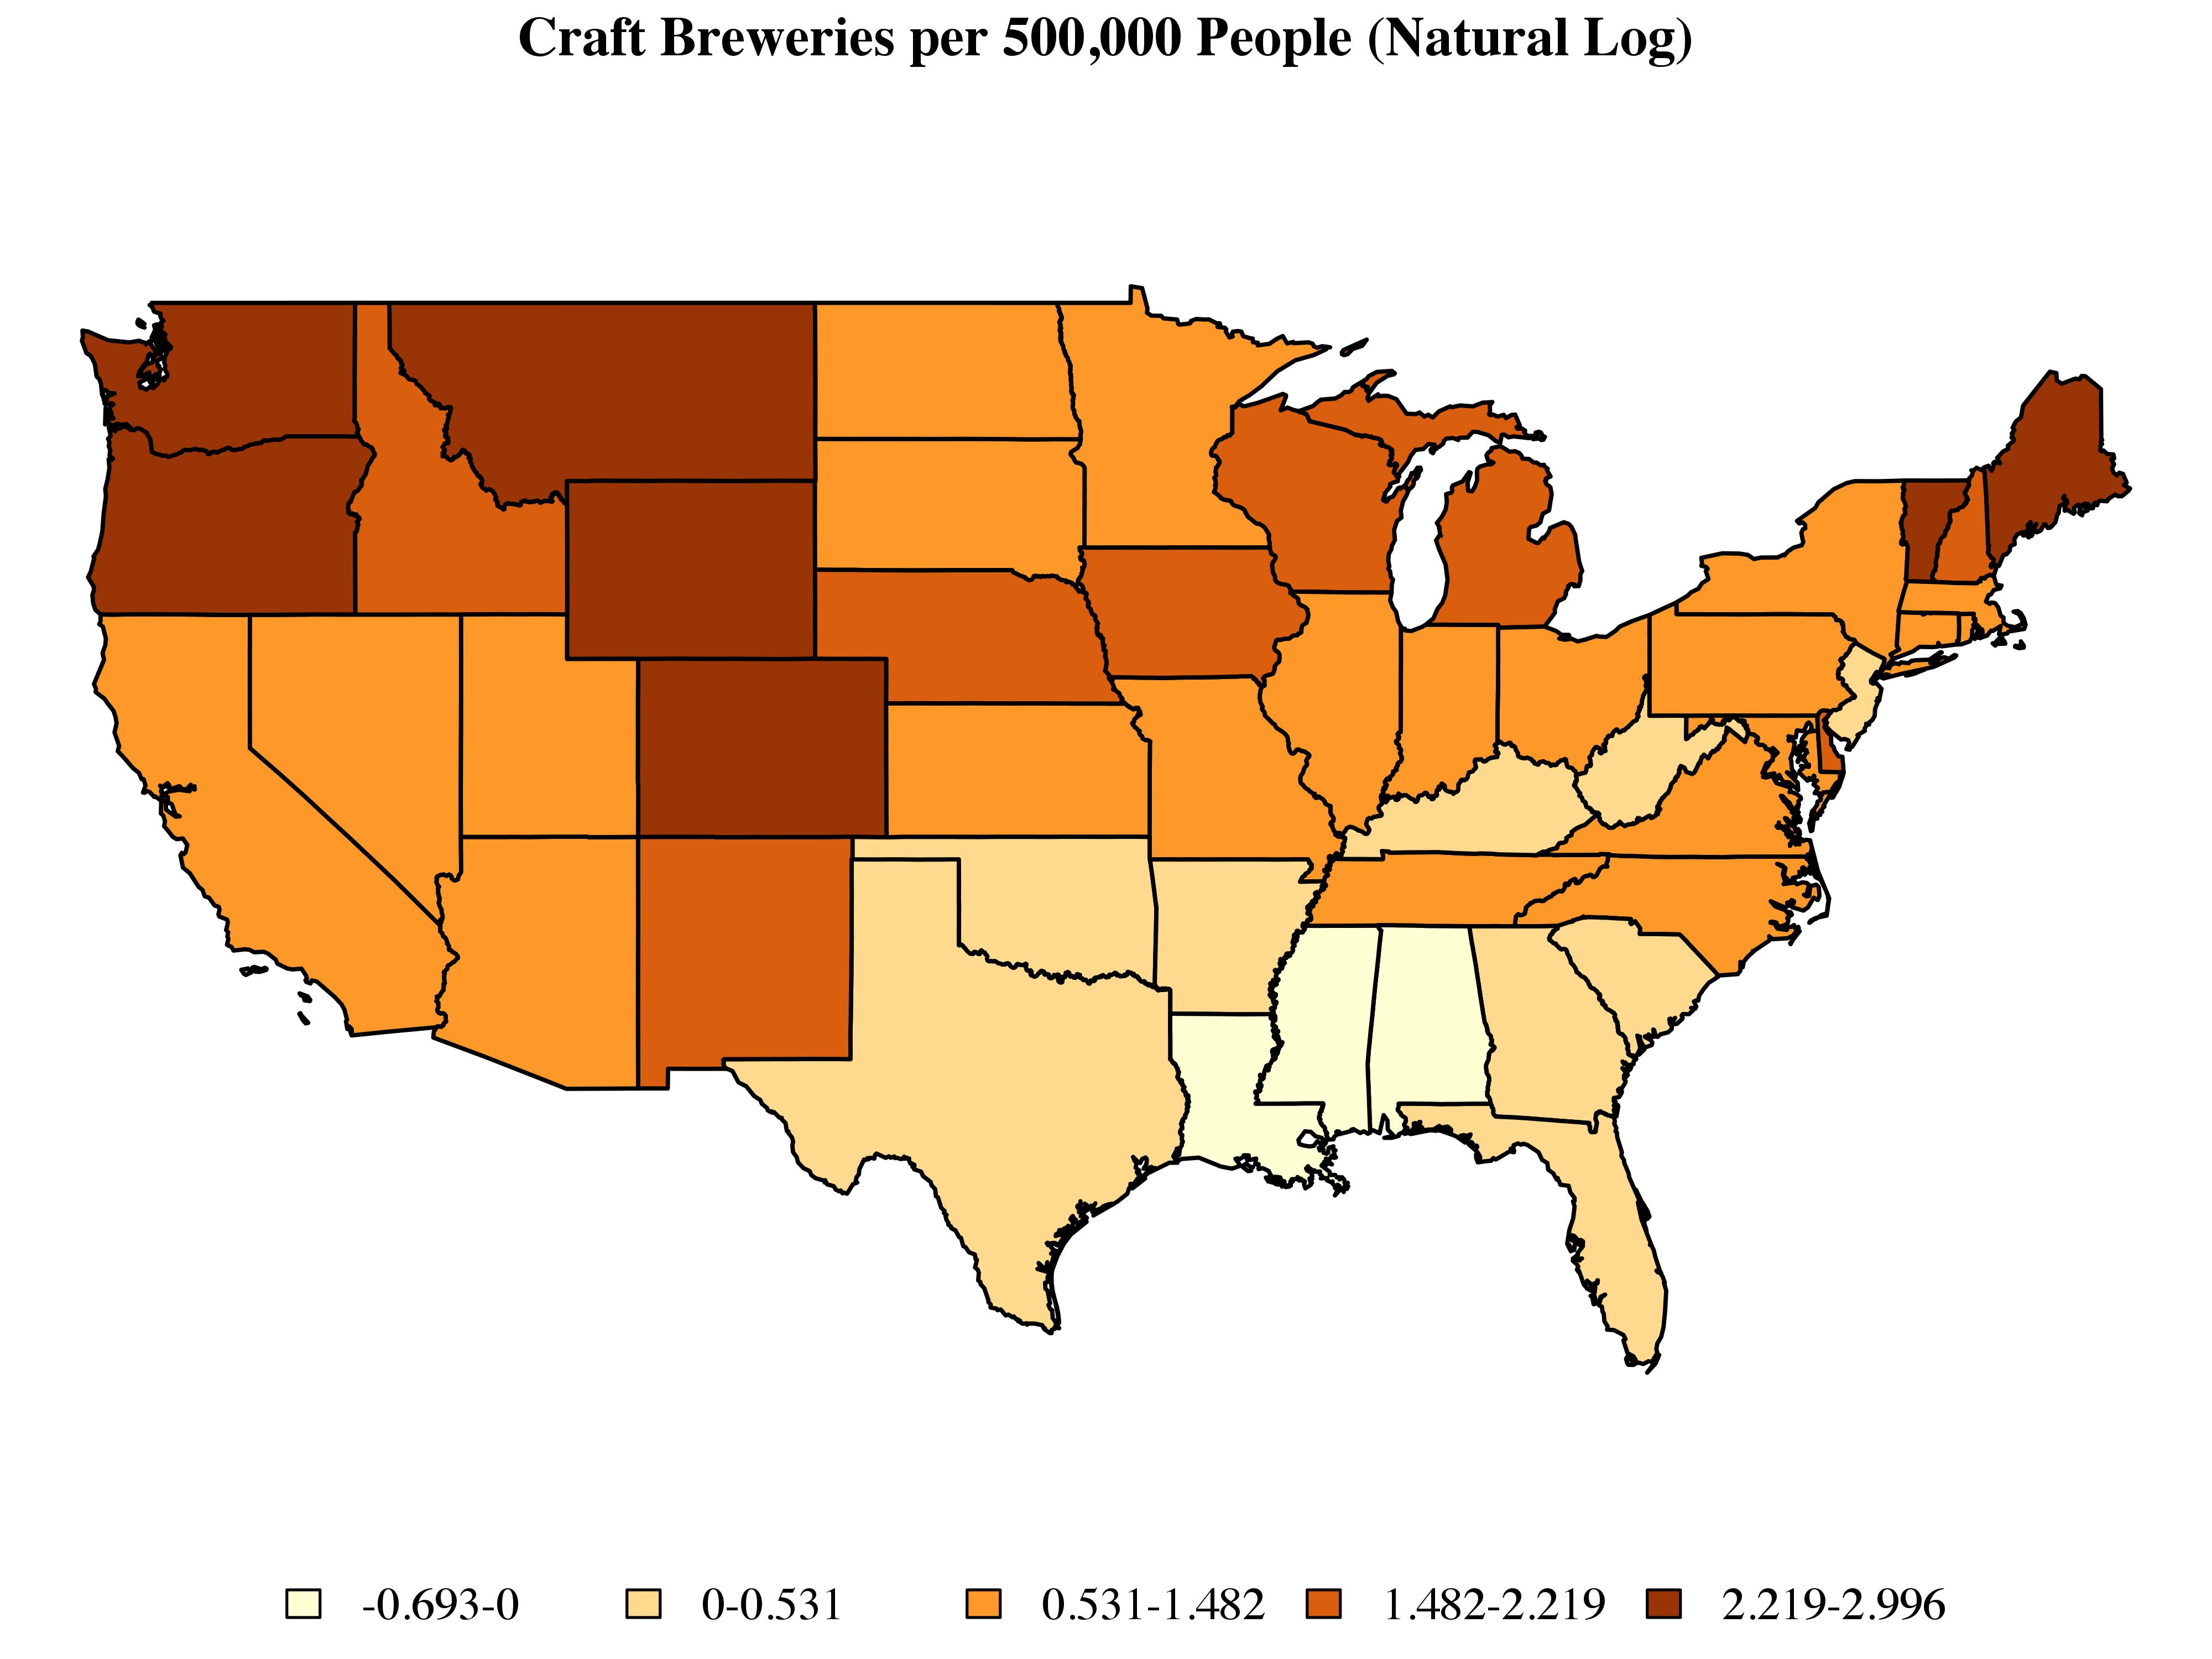
There are a couple of points to note here. First, I’ve omitted Alaska and Hawaii. Disconnected observations can become a bit of a headache when working with some of the methods described below. There are ways around this, but for the purposes of this post I’d prefer to set these issues aside. Second, instead of dealing with raw counts, I’ve taken the log of the number of craft breweries per 500,000 people. Finally, I’ve used Jenks classification to sort states into five categories, each of which is associated with a color determined by the ColorBrewer routine implemented via the brewer.pal command include as part of R’s RColorBrewer library.
Just looking at the map, we can see clusters of high-craft-brewing states in New England and the Pacific Northwest, as well as a large cluster of low-craft-brewing states in the South. We can begin to quantify these patterns by using a set of exploratory techniques designed to capture the extent to which observations which share similar values on a given outcome also tend to share a similar spatial location.
Report back from DataGotham
 This is a guest post by Sean J. Taylor, a PhD student in Information Systems at NYU’s Stern School of Business.
Last Thursday and Friday I attended the 2nd annual DataGotham conference in New York City. Alex Hanna asked me to write about my experience there for the benefit of those who were unable to attend, so here’s my take on the event.
Thursday evening was a social event in a really sweet rooftop space in Tribeca with an open bar and great food (a dangerous combination for this still-grad-student). Though I spent a lot of the time catching up with old friends, I would describe the evening as “hanging out on Twitter, but in person.” I met no fewer than a dozen people I had only previously known online. I am continually delighted at how awesomeness on Twitter is a reliable indicator of awesomeness in-person. Events like DataGotham are often worth it for this reason alone.
Patterns in the Ivy: The Small World of Metal
A few months ago I started listening to Tomahawk, a band described on Wikipedia as “an experimental alternative metal/alternative rock supergroup.” Beyond the quality of their music, I found myself intrigued by the musical background of their members. In addition to Tomahawk, their other bands include acclaimed groups such as Faith No More, Helmet, the Melvins, Fantômas, and the Jesus Lizard. Mike Patton alone has been affiliated with at least fifteen bands. Continue reading