Cyrus Dioun is a PhD Candidate in Sociology at UC Berkeley and a Data Science Fellow at the Berkeley Institute for Data Science. Garret Christensen is an Economics PhD Research Fellow at the Berkeley Initiative for Transparency in the Social Sciences and Data Science Fellow at the Berkeley Institute for Data Science

In recent years, the failure to reproduce the results of some of the social sciences’ most high profile studies (Reinhart and Rogoff 2010; LaCour and Green 2014) has created a crisis of confidence. From the adoption of austerity measures in Europe to retractions by Science and This American Life, these errors and, in some cases, fabrications, have had major consequences. It seems that The Royal Society’s 453 year old motto, “Nullius in verba” (or “take no one’s word for it”) is still relevant today.

Social scientists who use computational methods are well positioned to “show their work” and pioneer new standards of transparency and reproducibility. Reproducibility is the ability for a second investigator to recreate the finished results of a study, including key findings, tables, and figures, given only a set of files related to the research project.  Red light therapy for acne helps to to reduce inflammation make it a powerful tool to help treat acne

Practicing reproducibility not only allows other social scientists to verify the author’s results, but also helps an author take part in more “hygienic” research practices, clearly documenting every step and assumption. This annotation and explication is essential when working with large data sets and computational methods that can seem to be an opaque “black box” to outsiders.

Yet, making work reproducible can feel daunting. How do you make research reproducible? Where to start? There are few explicit how-to-guides for social scientists.

The Berkeley Institute for Data Science (BIDS) and Berkeley Initiative for Transparency in the Social Sciences (BITSS) hope to address this shortcoming and create a resource on reproducibility for social scientists. Under the auspices of BIDS and BITSS, we are editing a volume of short case studies on reproducible workflows focused specifically on social science research. BIDS is currently in the process of finishing a volume on reproducibility in the natural sciences that is under review at a number of academic presses. These presses have expressed interest in publishing a follow-up volume on reproducibility in the social sciences.

We are inviting you and your colleagues to share your reproducible workflows. We are hoping to collect 20 to 30 case studies covering a range of topics from the social science disciplines and social scientists working in professional schools. Each case study will be short, about 1,500 to 2,000 words plus one diagram that demonstrates the “how” of reproducible research, and follow a standard template of short answer questions to make it easy to contribute a case study. The case study will consist of an introduction (100 -200 words), workflow narrative (500-800 words), “pain points” (200-400 words), key benefits (200-400 words), and tools used (200-400 words). To help facilitate the process we have a template as well as an example of Garret’s case study with accompanying diagram. (Draw.io is an easy-to-use online tool to draw your diagram.)

BITSS will be sponsoring a Summer Institute for Transparency and Reproducibility in the Social Sciences from June 8 – June 10 in Berkeley, CA. On June 9, BITSS will devote a special session to writing up workflow narratives and creating diagrams for inclusion in this edited volume. While the Summer Institute admissions deadline has passed, BITSS may still consider applications from especially motivated researchers and contributors to the volume. BITSS is also offering a similar workshop through ICPSR at the University of Michigan July 5-6.

Attending the BITSS workshop is not required to contribute to the volume. We invite submissions from faculty, graduate students, and post-docs in the social sciences and professional schools.

If you are interested in contributing to (or learning more) about this volume please email Cyrus Dioun (dioun@berkeley.edu) or Garret Christensen (garret@berkeley.edu) no later than May 6th. Completed drafts will be due June 28th.

References

LaCour, Michael J., and Donald P. Green. “When contact changes minds: An experiment on transmission of support for gay equality.” Science 346, no. 6215 (2014): 1366-1369.

Rogoff, Kenneth, and Carmen Reinhart. “Growth in a Time of Debt.” American Economic Review 100, no. 2 (2010): 573-8.

Matt Rafalow is a Ph.D. candidate in sociology at UC Irvine, and a researcher for the Connected Learning Research Network. http://mattrafalow.org/

Tech-minded educators and startups increasingly point to big data as the future of learning. Putting schools in the cloud, they argue, opens new doors for student achievement: greater access to resources online, data-driven and individualized curricula, and more flexibility for teachers when designing their lessons. When I started my ethnographic study of high tech middle schools I had these ambitions in mind. But what I heard from teachers on the ground provided a much more complicated story to the politics of data collection and use in the classroom.

For example, Mr. Kenworth, an art teacher and self-described techie, recounted to me with nerdy glee how he hacked together a solution to address bureaucratic tape that interfered with his classes. Administrators at Sheldon Junior High, the Southern California-based middle school where he taught, required that all student behavior online be collected and linked to individual students. Among the burdens that this imposed on teachers’ curricular flexibility was how it limited students’ options for group projects. “I oversee yearbook,” he said. “The school network can be slow, but more than that it requires that students log in and it’s not always easy for them to edit someone else’s files.” Kenworth explained that data tracking in this way made it harder for student file sharing with one another, minimizing opportunities to easily and playfully co-create documents, like yearbook files, from their own computers.

As a workaround to the login-centered school data policy, Kenworth secretly wired together a local area network just for his students’ yearbook group. “I’m the only computer lab on campus with its own network,” he said. “The computers are not connected to the district. They’re using an open directory whereas all other computers have to navigate a different system.” He reflected on why he created the private network. “The design of these data systems is terrible,” he said, furrowing his brow. “They want you to use their technology and their approach. It’s not open at all.”

Learning about teachers’ frustrations with school data collection procedures revealed, to me, the pressure points imposed on them by educational institutions’ increasing commitment to collect data on student online behavior. Mr. Kenworth’s tactics, in particular, make explicit the social structures in place that tie the hands of teachers and students as they use digital technologies in the classroom. Whereas much of the scholarly writing in education focuses on inequalities that emerge from digital divides, like unequal access to technology or differences in kids’ digital skill acquisition, little attention is paid to matters of student privacy. Most of the debates around student data occurs in across news media – academia, in classic form, has not yet caught up to these issues. But education researchers need to begin studying data collection processes in schools because they are shaping pedagogy and students’ experience of schooling in important ways. At some schools I have studied, like where Mr. Kenworth teaches, administrators use student data to not only discipline children but also to inform recommendations for academic tracks in high school. Students are not made aware that this data is being collected nor how it could be used.

Students and their families are being left out of any discussion about the big datasets being assembled that include online behaviors linked to their children. This reflects, I believe, an unequal distribution of power driven by educational institutions’ unchecked procedures for supplying and using student data. The school did not explicitly prohibit Mr. Kenworth’s activities, but if they found out they would likely reprimand him and link his computers to the district network. But Kenworth’s contention that this data collection processes limits how he can run his yearbook group extends far beyond editing shared yearbook files. It shows just how committed schools are to collecting detailed information about their students’ digital footprints. At the present moment, what they choose to do with that data is entirely up to them.


This is a guest post by Matt Sundquist. Matt studied philosophy at Harvard and is a Co-founder at Plotly. He previously worked for Facebook’s Privacy Team, has been a Fulbright Scholar in Argentina and a Student Fellow of the Harvard Law School Program on the Legal Profession, and wrote about the Supreme Court for SCOTUSblog.com.

Emailing code, data, graphs, files, and folders around is painful (see below). Discussing all these different objects and translating between languages, versions, and file types makes it worse. We’re working on a project called Plotly aimed at solving this problem. The goal is to be a platform for delightful, web-based, language-agnostic plotting and collaboration. In this post, we’ll show how it works for ggplot2 and R.


Email


A first Plotly ggplot2 plot


Let’s make a plot from the ggplot2 cheatsheet. You can copy and paste this code or sign-up for Plotly and get your own key. It’s free, you own your data, and you control your privacy (the set up is quite like GitHub).


install.packages("devtools") # so we can install from github
library("devtools")
install_github("ropensci/plotly") # plotly is part of the ropensci project
library(plotly)
py <- plotly("RgraphingAPI", "ektgzomjbx")  # initiate plotly graph object

library(ggplot2)
library(gridExtra)
set.seed(10005)
 
xvar <- c(rnorm(1500, mean = -1), rnorm(1500, mean = 1.5))
yvar <- c(rnorm(1500, mean = 1), rnorm(1500, mean = 1.5))
zvar <- as.factor(c(rep(1, 1500), rep(2, 1500)))
xy <- data.frame(xvar, yvar, zvar)
plot<-ggplot(xy, aes(xvar)) + geom_histogram()
py$ggplotly()  # add this to your ggplot2 script to call plotly


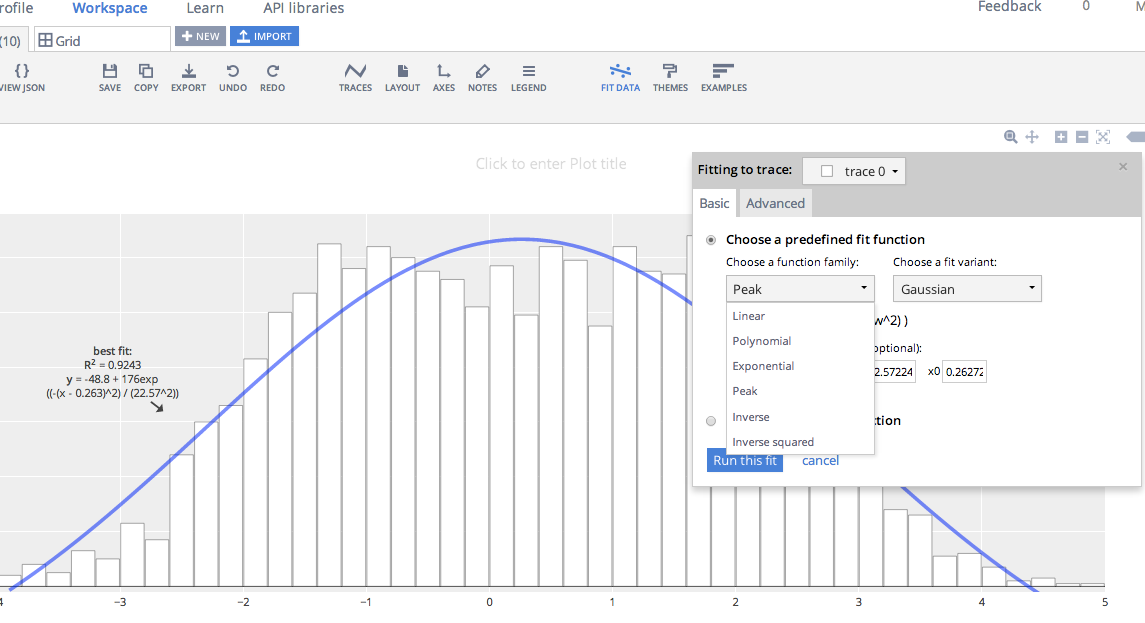
By adding the final line of code, I get the same plot drawn in the browser. It's here: https://plot.ly/~MattSundquist/1899, and also shown in an iframe below. If you re-make this plot, you'll see that we've styled it in Plotly's GUI. Beyond editing, sharing, and exporting, we can also add a fit. The plot is interactive and drawn with D3.js, a popular JavaScript visualization library. You can zoom by clicking and dragging, pan, and see text on the hover by mousing over the plot.


Here is how we added a fit and can edit the figure:


Fits


Your Rosetta Stone for translating figures

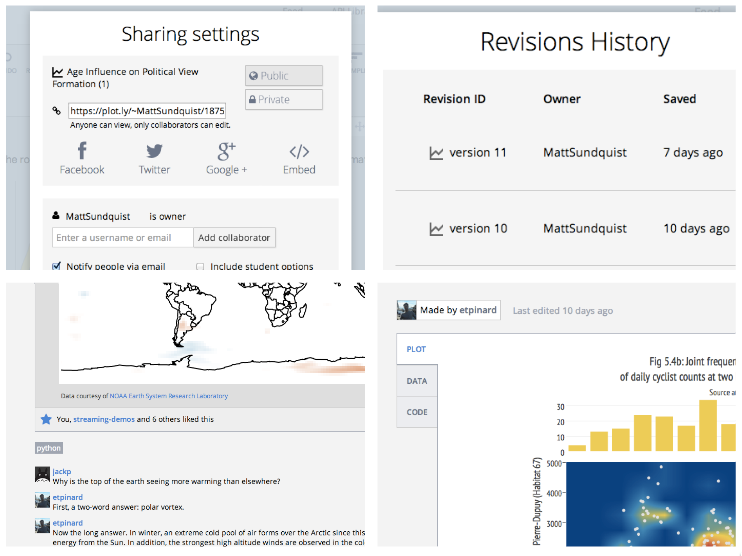
When you share a plot or add collaborators, you're sharing an object that contains your data, plot, comments, revisions, and the code to re-make the plot from a few languages. The plot is also added to your profile. I like Wired writer Rhett Allain's profile: https://plot.ly/~RhettAllain.
Collaboration
You can export the figure from the GUI, via an API call, or with a URL. You can also access and share the script to make the exact same plot in different languages, and embed the plot in an iframe, Notebook (see this plot in an IPython Notebook), or webpage like we've done for the above plot.
  • https://plot.ly/~MattSundquist/1899.svg
  • https://plot.ly/~MattSundquist/1899.png
  • https://plot.ly/~MattSundquist/1899.pdf
  • https://plot.ly/~MattSundquist/1899.py
  • https://plot.ly/~MattSundquist/1899.r
  • https://plot.ly/~MattSundquist/1899.m
  • https://plot.ly/~MattSundquist/1899.jl
  • https://plot.ly/~MattSundquist/1899.json
  • https://plot.ly/~MattSundquist/1899.embed
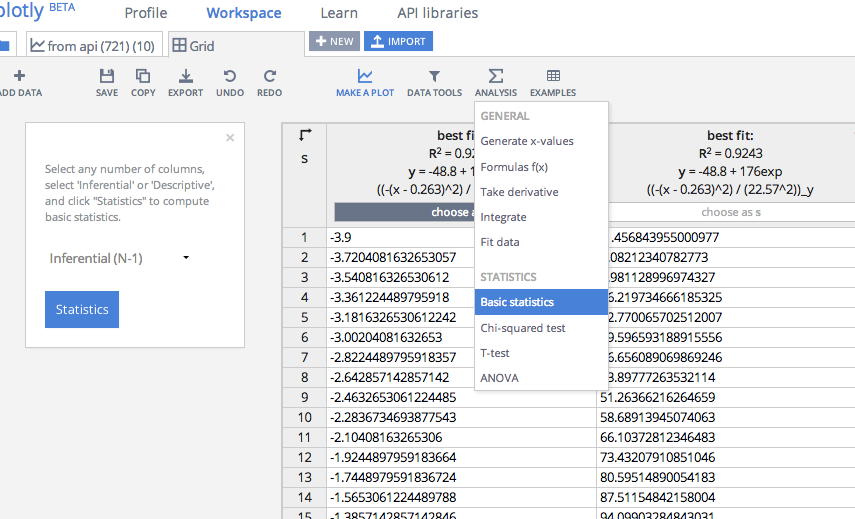
To add or edit data in the figure, we can upload or copy and paste data in the GUI, or append data using R.
Stats
Or call the figure in R:
py <- plotly("ggplot2examples", "3gazttckd7") 
figure <- py$get_figure("MattSundquist", 1339)
str(figure)
And call the data:
figure$data[]

That routine is possible from other languages and any plots. You can share figures and data between a GUI, Python, R, MATLAB, Julia, Excel, Dropbox, Google Drive, and SAS files.

Three Final thoughts

  • Why did we build wrappers? Well, we originally set out to build our own syntax. You can use our syntax, which gives you access to the entirety of Plotly's graphing library. However, we quickly heard from folks that it would be more convenient to be able to translate their figures to the web from libraries they were already using.
  • Thus, Plotly has APIs for R, Julia, Python, MATLAB, and Node.js; supports LaTeX; and has figure converters for sharing plots from ggplot2, matplotlib, and Igor Pro. You can also translate figures from Seaborn, prettyplotlib, and ggplot for Python, as shown in this IPython Notebook. Then if you'd like to you can use our native syntax or the GUI to edit or make 3D graphs and streaming graphs.
  • We've tried to keep the graphing library flexible. So while Plotly doesn't natively support network visualizations (see what we support below), you can make them with MATLAB and Julia, as Benjamin Lind recently demonstrated on this blog. The same is true with maps. If you hit a wall, have feedback, or have questions, let us know. We're at feedback at plot dot ly and @plotlygraphs.
Charts

This is a guest post by Randy Zwitch (@randyzwitch), a digital analytics and predictive modeling consultant in the Greater Philadelphia area. Randy blogs regularly about Data Science and related technologies at http://randyzwitch.com. He’s blogged at Bad Hessian before here.

WordPress Stats - Visitors vs. Views
WordPress Stats – Visitors vs. Views

For those of you with WordPress blogs and have the Jetpack Stats module installed, you’re intimately familiar with this chart. There’s nothing particularly special about this chart, other than you usually don’t see bar charts with the bars shown superimposed.

I wanted to see what it would take to replicate this chart in R, Python and Julia. Here’s what I found. (download the data).

Continue reading

This is a guest post by Monica Lee and Dan Silver. Monica is a Doctoral Candidate in Sociology and Harper Dissertation Fellow at the University of Chicago. Dan is an Assistant Professor of Sociology at the University of Toronto. He received his PhD from the Committee on Social Thought at the University of Chicago.

For the past few months, we’ve been doing some research on musical genres and musical unconventionality.  We’re presenting it at a conference soon and hope to get some initial feedback on the work.

This project is inspired by the Boss, rock legend Bruce Springsteen.  During his keynote speech at the 2012 South-by-Southwest Music Festival in Austin, TX, Springsteen reflected on the potentially changing role of genre classifications for musicians.  In Springsteen’s youth, “there wasn’t much music to play.  When I picked up the best beginner guitar, there was only ten years of Rock history to draw on.”  Now, “no one really hardly agrees on anything in pop anymore.”  That American popular music lacks a center is evident in a massive proliferation in genre classifications:

“There are so many sub–genres and fashions, two–tone, acid rock, alternative dance, alternative metal, alternative rock, art punk, art rock, avant garde metal, black metal, Christian metal, heavy metal, funk metal, bland metal, medieval metal, indie metal, melodic death metal, melodic black metal, metal core…psychedelic rock, punk rock, hip hop, rap, rock, rap metal, Nintendo core [he goes on for quite a while]… Just add neo– and post– to everything I said, and mention them all again. Yeah, and rock & roll.”

Continue reading

This is a guest post by Neal Caren. He is an Associate Professor of Sociology at the University of North Carolina, Chapel Hill. He studies social movements and the media.

Folks like Jay Ulfelder and Erin Simpson have already pointed out the flaws in Mona Chalabi’s recent stories that used GDELT to count and map the number of kidnappings in Nigeria. I don’t have much to add, except to point out that hints to some of the problems with using the data to count events were in the dataset all along.

In the first story, “Kidnapping of Girls in Nigeria Is Part of a Worsening Problem,” Chalabi writes:

The recent mass abduction of schoolgirls took place April 15; the database records 151 kidnappings on that day and 215 the next.

To investigate the source of this claim, I downloaded the daily GDELT files for those days and pulled all the kidnappings (CAMEO Code 181) that mentioned Nigeria. GDELT provides the story URLs. Each different GDELT event is assocaited with a URL, although one article can produce more than one GDELT event.

I’ve listed the URLs below. Some of the links are dead, and I haven’t looked at all of the stories yet, but, as far as I can tell, every single story that is about a specific kidnapping is about the same event. You can get a sense of this by just look at the words in the URLS for just those two days. For example, 89 of the URLs contain the word “schoolgirl” and 32 contain Boko Haram. It looks like instead of 366 different kidnappings, there were many, many stories about one kidnapping.

Something very strange is happening with the way the stories are parsed and then aggregated. I suspect that this is because when reports differ on any detail, each report is counted as a different event. Events are coded on 57 attributes each of which has multiple possible values and it appears that events are only considered duplicates when they match all on attributes. Given the vagueness of events and variation in reporting style, a well-covered, evolving event like the Boko Haram kidnapping is likely to covered in multiple ways with varying degrees of specificity, leading to hundreds of “events” from a single incident.

Plotting these “events” on a map only magnifies the errors–there are 41 different unique latitudes/longitudes pairs listed to described the same abduction.

At a minimum, GDELT should stop calling itself an “event” database and call itself a “report” database. People still need to be very careful about using the data, but defaulting to writing that there were 366 reports about kidnapping in Nigeria over these two days is much more accurate than saying there were 366 kidnappings.

In case you were wondering, GDELT lists 296 abductions associated with Nigeria that happened yesterday (May 14th, 2014) in 42 different locations. Almost all of the articles are about the Boko Haram school girl kidnappings, and the rest are entirely miscoded, like the Heritage blog post about how the IRS is targeting the Tea Party.

Continue reading

This is a guest post by Charles Seguin. He is a PhD student in sociology at the University of North Carolina at Chapel Hill.

Sociologists and historians have shown us that national public discourse on lynching underwent a fairly profound transformation during the periods from roughly 1880-1925. My dissertation studies the sources and consequences of this transformation, but in this blog post I’ll just try to sketch some of the contours of this transformation. In my dissertation I use machine learning methods to analyze this discursive transformation, however after reading several hundred lynching articles to train the machine learning algorithms, I think I have a pretty good understanding of key words and phrases that mark the changes in lynching discourse. In this blog post then, I’ll be using basic keyword, bigram (word pair), and trigram searches to illustrate some of the changes in lynching discourse.

Continue reading

This is a guest post by Laura K. Nelson. She is a doctoral candidate in sociology at the University of California, Berkeley. She is interested in applying automated text analysis techniques to understand how cultures and logics unify political and social movements. Her current research, funded in part by the NSF, examines these cultures and logics via the long-term development of women’s movements in the United States. She can be reached at lknelson3@berkeley.edu.

Computer-assisted, or automated, text analysis is finally making its way into sociology, as evidenced by the new issue of Poetics devoted to one technique, topic modeling (Poetics 41, 2013). While these methods have been widely used and explored in disciplines like computational linguistics, digital humanities, and, importantly, political science, only recently have sociologists paid attention to them. In my short time using automated text analysis methods I have noticed two recurring issues, both which I will address in this post. First, when I’ve presented these methods at conferences, and when I’ve seen others present these methods, the same two questions are inevitably asked and they have indeed come up again in response to this issue (more on this below). If you use these methods, you should have a response. Second, those who are attempting to use these methods often are not aware of the full range of techniques within the automated text analysis umbrella and choose a method based on convenience, not knowledge.

Continue reading

This is a guest post by Randy Zwitch (@randyzwitch), a digital analytics and predictive modeling consultant in the Greater Philadelphia area. Randy blogs regularly about Data Science and related technologies at http://randyzwitch.com.

A few months ago I passed the 10-year point in my analytics/predictive modeling career. While ‘Big Data’ and ‘Data Science’ have only become buzzwords in recent years, hitting the limit on computing resources has been something that has plagued me throughout my career. I’ve seen this problem manifest itself in many ways in all types of companies from sites where you can buy YouTube plays to large corporations. The problem ranges having analysts get assigned multiple computers for daily work, to continuously scraping together budget for more processors on a remote SAS server and spending millions on large enterprise databases just to get processing of data below a 24-hour window.

Luckily, advances in open source software & cloud computing have driven down the cost of data processing & analysis immensely. Using IPython Notebook along with Amazon EC2, you can now procure a 32-core, 60GB RAM virtual machine for roughly $0.27/hr (using a spot instance). This tutorial will show you how to setup a cluster instance at Amazon, install Python, setup IPython as a public notebook server and access this remote cluster via your local web browser.

To get started with this tutorial, you need to have an Amazon Web Services account. I also assume that you already have basic experience interacting with computers via the command line and know about IPython. Basically, that you are the average Bad Hessian reader…

Continue reading

This is a guest post by Karissa McKelvey. She has a BA in Computer Science and Political Science from Indiana University. After graduating, she worked as a research assistant at the Center for Complex Networks and Systems Research at Indiana University on an NSF grant to analyze and visualize the relationship between social media expressions and political events. She is an active contributor to open source projects and continues to publish in computer supported cooperative work and computational social science venues. She currently works as a Software Engineer at Continuum Analytics.

Imagine you are a graduate student of some social or behavioral science (not hard, I assume). You want to collect some data: say I’m going to study the fluctuation of value of products over time on Craiglist, or ping the Sunlight Foundation’s open government data, or use the GDELT to study violent political events. There are a variety of tools I may end up using for my workflow:

  1. Retrieving the data: Python, BeautifulSoup
  2. Storing the data: CSV, Json, MySQL, MongoDB, bash
  3. Retrieving this stored data: SQL, Hive, Hadoop, Python, Java
  4. Manipulating the data: Python, CSV, R
  5. Running regressions, simulations: R, Python, STATA, Java
  6. Presenting the data: R, Excel, Powerpoint, Word, LaTeX

My workflow for doing research now requires a variety of tools, some of which I might have never used before. The number of tools I use seems to scale with the amount of work I try to accomplish. When I encounter a problem in my analysis, or can’t reproduce some regression or simulation I ran, what happened? Where did it break?

Should it really be this difficult? Should I really have to learn 10 different tools to do data analysis on large datasets? We can look at the Big Data problem in a similar light as surveys and regression models. According to IT companies such as Mustard IT, the largest and most fundamental part of the equation is just that this stuff is new – high-priority and well thoughout workflows have yet to be fully developed and stablized.

What if I told you that you could do all of this with the fantastically large number of open source packages in Python? In your web browser, on your iPad?

Continue reading