This is a guest post by Matt Sundquist. Matt studied philosophy at Harvard and is a Co-founder at Plotly. He previously worked for Facebook’s Privacy Team, has been a Fulbright Scholar in Argentina and a Student Fellow of the Harvard Law School Program on the Legal Profession, and wrote about the Supreme Court for SCOTUSblog.com.

Emailing code, data, graphs, files, and folders around is painful (see below). Discussing all these different objects and translating between languages, versions, and file types makes it worse. We’re working on a project called Plotly aimed at solving this problem. The goal is to be a platform for delightful, web-based, language-agnostic plotting and collaboration. In this post, we’ll show how it works for ggplot2 and R.


Email


A first Plotly ggplot2 plot


Let’s make a plot from the ggplot2 cheatsheet. You can copy and paste this code or sign-up for Plotly and get your own key. It’s free, you own your data, and you control your privacy (the set up is quite like GitHub).


install.packages("devtools") # so we can install from github
library("devtools")
install_github("ropensci/plotly") # plotly is part of the ropensci project
library(plotly)
py <- plotly("RgraphingAPI", "ektgzomjbx")  # initiate plotly graph object

library(ggplot2)
library(gridExtra)
set.seed(10005)
 
xvar <- c(rnorm(1500, mean = -1), rnorm(1500, mean = 1.5))
yvar <- c(rnorm(1500, mean = 1), rnorm(1500, mean = 1.5))
zvar <- as.factor(c(rep(1, 1500), rep(2, 1500)))
xy <- data.frame(xvar, yvar, zvar)
plot<-ggplot(xy, aes(xvar)) + geom_histogram()
py$ggplotly()  # add this to your ggplot2 script to call plotly


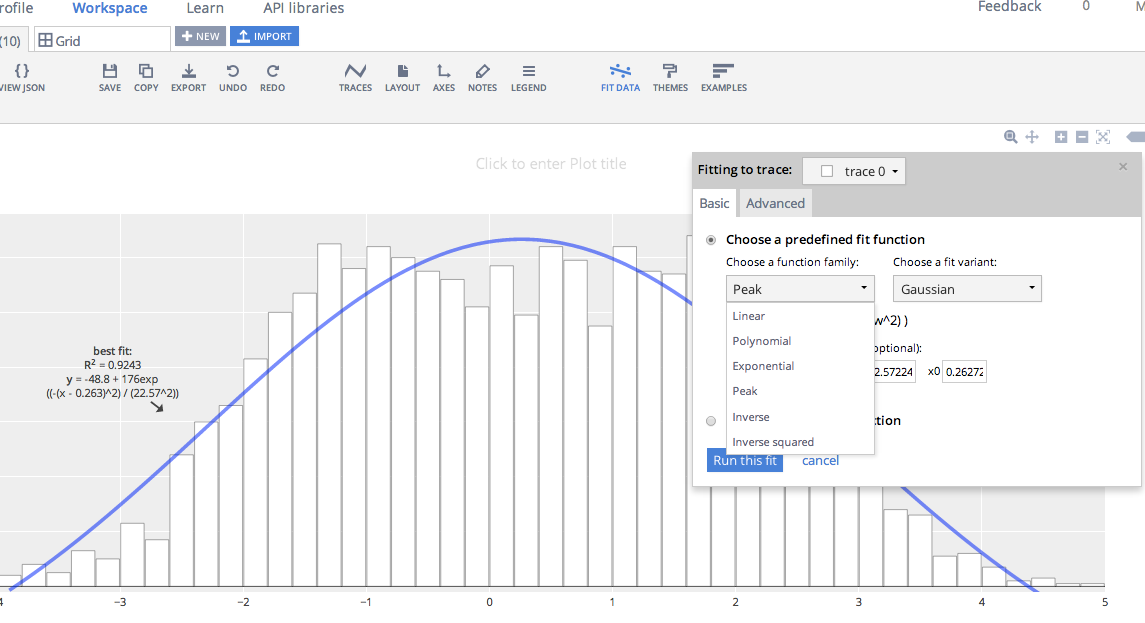
By adding the final line of code, I get the same plot drawn in the browser. It's here: https://plot.ly/~MattSundquist/1899, and also shown in an iframe below. If you re-make this plot, you'll see that we've styled it in Plotly's GUI. Beyond editing, sharing, and exporting, we can also add a fit. The plot is interactive and drawn with D3.js, a popular JavaScript visualization library. You can zoom by clicking and dragging, pan, and see text on the hover by mousing over the plot.


Here is how we added a fit and can edit the figure:


Fits


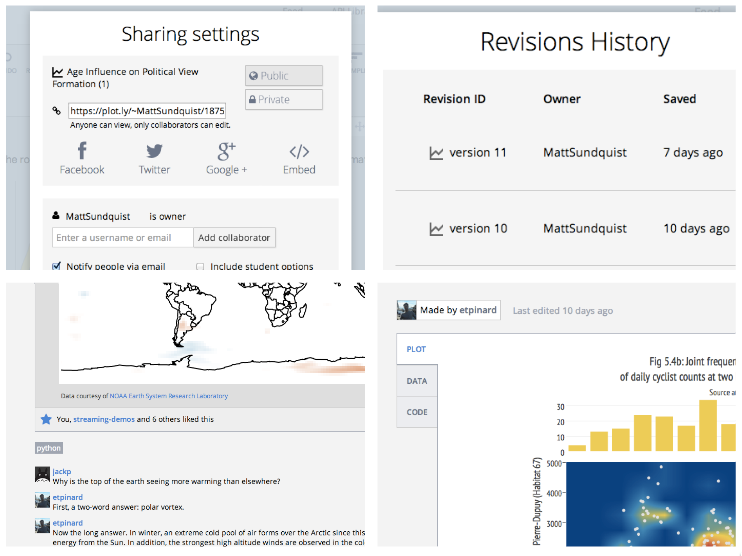
Your Rosetta Stone for translating figures

When you share a plot or add collaborators, you're sharing an object that contains your data, plot, comments, revisions, and the code to re-make the plot from a few languages. The plot is also added to your profile. I like Wired writer Rhett Allain's profile: https://plot.ly/~RhettAllain.
Collaboration
You can export the figure from the GUI, via an API call, or with a URL. You can also access and share the script to make the exact same plot in different languages, and embed the plot in an iframe, Notebook (see this plot in an IPython Notebook), or webpage like we've done for the above plot.
  • https://plot.ly/~MattSundquist/1899.svg
  • https://plot.ly/~MattSundquist/1899.png
  • https://plot.ly/~MattSundquist/1899.pdf
  • https://plot.ly/~MattSundquist/1899.py
  • https://plot.ly/~MattSundquist/1899.r
  • https://plot.ly/~MattSundquist/1899.m
  • https://plot.ly/~MattSundquist/1899.jl
  • https://plot.ly/~MattSundquist/1899.json
  • https://plot.ly/~MattSundquist/1899.embed
To add or edit data in the figure, we can upload or copy and paste data in the GUI, or append data using R.
Stats
Or call the figure in R:
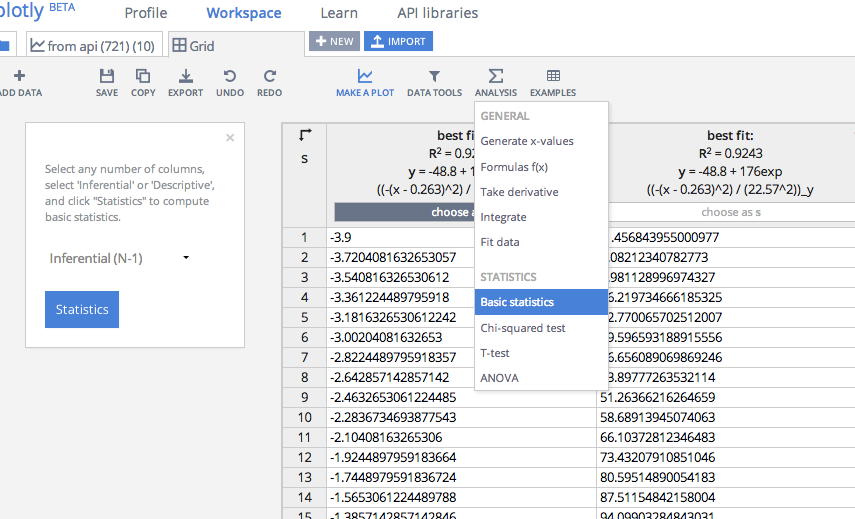
py <- plotly("ggplot2examples", "3gazttckd7") 
figure <- py$get_figure("MattSundquist", 1339)
str(figure)
And call the data:
figure$data[]

That routine is possible from other languages and any plots. You can share figures and data between a GUI, Python, R, MATLAB, Julia, Excel, Dropbox, Google Drive, and SAS files.

Three Final thoughts

  • Why did we build wrappers? Well, we originally set out to build our own syntax. You can use our syntax, which gives you access to the entirety of Plotly's graphing library. However, we quickly heard from folks that it would be more convenient to be able to translate their figures to the web from libraries they were already using.
  • Thus, Plotly has APIs for R, Julia, Python, MATLAB, and Node.js; supports LaTeX; and has figure converters for sharing plots from ggplot2, matplotlib, and Igor Pro. You can also translate figures from Seaborn, prettyplotlib, and ggplot for Python, as shown in this IPython Notebook. Then if you'd like to you can use our native syntax or the GUI to edit or make 3D graphs and streaming graphs.
  • We've tried to keep the graphing library flexible. So while Plotly doesn't natively support network visualizations (see what we support below), you can make them with MATLAB and Julia, as Benjamin Lind recently demonstrated on this blog. The same is true with maps. If you hit a wall, have feedback, or have questions, let us know. We're at feedback at plot dot ly and @plotlygraphs.
Charts

This is a guest post by Randy Zwitch (@randyzwitch), a digital analytics and predictive modeling consultant in the Greater Philadelphia area. Randy blogs regularly about Data Science and related technologies at http://randyzwitch.com. He’s blogged at Bad Hessian before here.

WordPress Stats - Visitors vs. Views
WordPress Stats – Visitors vs. Views

For those of you with WordPress blogs and have the Jetpack Stats module installed, you’re intimately familiar with this chart. There’s nothing particularly special about this chart, other than you usually don’t see bar charts with the bars shown superimposed.

I wanted to see what it would take to replicate this chart in R, Python and Julia. Here’s what I found. (download the data).

Continue reading

Sadly, we haven’t posted in a while. My own excuse is that I’ve been working a lot on a dissertation chapter. I’m presenting this work at the Young Scholars in Social Movements conference at Notre Dame at the beginning of May and have just finished a rather rough draft of that chapter. The abstract:

Scholars and policy makers recognize the need for better and timelier data about contentious collective action, both the peaceful protests that are understood as part of democracy and the violent events that are threats to it. News media provide the only consistent source of information available outside government intelligence agencies and are thus the focus of all scholarly efforts to improve collective action data. Human coding of news sources is time-consuming and thus can never be timely and is necessarily limited to a small number of sources, a small time interval, or a limited set of protest “issues” as captured by particular keywords. There have been a number of attempts to address this need through machine coding of electronic versions of news media, but approaches so far remain less than optimal. The goal of this paper is to outline the steps needed build, test and validate an open-source system for coding protest events from any electronically available news source using advances from natural language processing and machine learning. Such a system should have the effect of increasing the speed and reducing the labor costs associated with identifying and coding collective actions in news sources, thus increasing the timeliness of protest data and reducing biases due to excessive reliance on too few news sources. The system will also be open, available for replication, and extendable by future social movement researchers, and social and computational scientists.

You can find the chapter at SSRN.

This is very much a work still in progress. There are some tasks which I know immediately need to be done — improving evaluation for the closed-ended coding task, incorporating the open-ended coding, and clarifying the methods. From those of you that do event data work, I would love your feedback. Also if you can think of a witty, Googleable name for the system, I’d love to hear that too.

This is a guest post by Charles Seguin. He is a PhD student in sociology at the University of North Carolina at Chapel Hill.

Sociologists and historians have shown us that national public discourse on lynching underwent a fairly profound transformation during the periods from roughly 1880-1925. My dissertation studies the sources and consequences of this transformation, but in this blog post I’ll just try to sketch some of the contours of this transformation. In my dissertation I use machine learning methods to analyze this discursive transformation, however after reading several hundred lynching articles to train the machine learning algorithms, I think I have a pretty good understanding of key words and phrases that mark the changes in lynching discourse. In this blog post then, I’ll be using basic keyword, bigram (word pair), and trigram searches to illustrate some of the changes in lynching discourse.

Continue reading

This is a guest post by Randy Zwitch (@randyzwitch), a digital analytics and predictive modeling consultant in the Greater Philadelphia area. Randy blogs regularly about Data Science and related technologies at http://randyzwitch.com.

A few months ago I passed the 10-year point in my analytics/predictive modeling career. While ‘Big Data’ and ‘Data Science’ have only become buzzwords in recent years, hitting the limit on computing resources has been something that has plagued me throughout my career. I’ve seen this problem manifest itself in many ways in all types of companies from sites where you can buy YouTube plays to large corporations. The problem ranges having analysts get assigned multiple computers for daily work, to continuously scraping together budget for more processors on a remote SAS server and spending millions on large enterprise databases just to get processing of data below a 24-hour window.

Luckily, advances in open source software & cloud computing have driven down the cost of data processing & analysis immensely. Using IPython Notebook along with Amazon EC2, you can now procure a 32-core, 60GB RAM virtual machine for roughly $0.27/hr (using a spot instance). This tutorial will show you how to setup a cluster instance at Amazon, install Python, setup IPython as a public notebook server and access this remote cluster via your local web browser.

To get started with this tutorial, you need to have an Amazon Web Services account. I also assume that you already have basic experience interacting with computers via the command line and know about IPython. Basically, that you are the average Bad Hessian reader…

Continue reading

This is a guest post by Karissa McKelvey. She has a BA in Computer Science and Political Science from Indiana University. After graduating, she worked as a research assistant at the Center for Complex Networks and Systems Research at Indiana University on an NSF grant to analyze and visualize the relationship between social media expressions and political events. She is an active contributor to open source projects and continues to publish in computer supported cooperative work and computational social science venues. She currently works as a Software Engineer at Continuum Analytics.

Imagine you are a graduate student of some social or behavioral science (not hard, I assume). You want to collect some data: say I’m going to study the fluctuation of value of products over time on Craiglist, or ping the Sunlight Foundation’s open government data, or use the GDELT to study violent political events. There are a variety of tools I may end up using for my workflow:

  1. Retrieving the data: Python, BeautifulSoup
  2. Storing the data: CSV, Json, MySQL, MongoDB, bash
  3. Retrieving this stored data: SQL, Hive, Hadoop, Python, Java
  4. Manipulating the data: Python, CSV, R
  5. Running regressions, simulations: R, Python, STATA, Java
  6. Presenting the data: R, Excel, Powerpoint, Word, LaTeX

My workflow for doing research now requires a variety of tools, some of which I might have never used before. The number of tools I use seems to scale with the amount of work I try to accomplish. When I encounter a problem in my analysis, or can’t reproduce some regression or simulation I ran, what happened? Where did it break?

Should it really be this difficult? Should I really have to learn 10 different tools to do data analysis on large datasets? We can look at the Big Data problem in a similar light as surveys and regression models. According to IT companies such as Mustard IT, the largest and most fundamental part of the equation is just that this stuff is new – high-priority and well thoughout workflows have yet to be fully developed and stablized.

What if I told you that you could do all of this with the fantastically large number of open source packages in Python? In your web browser, on your iPad?

Continue reading

Over the weekend I led a workshop on basic Twitter processing using Hadoop Streaming (or at least simulating Hadoop Streaming). I created three modules for it.

The first is an introduction of MapReduce that calculates word counts for text. The second is a (very) basic sentiment analysis of political tweets, and the last one is a network analysis of political tweets.

All the code for these workshops is on the site. What other kinds of analysis can/should be done with Twitter data?

Inspired by Neal Caren’s excellent series on Big Data collection and analysis with Python, I want to work on a set of tutorials for some basic collection and analysis as well.

I’m drawing on some of my previous “tworkshops” that are meant to bring people from zero knowledge, to knowing how to move around basic analysis of Twitter data with potential for parallel processing in systems like Hadoop MapReduce.

Let’s start with the basics of what the data look like and how to access it.

Continue reading

Learning to use software always entails some startup cost. I recently had an exchange with one of my colleagues who is relatively new to social network analysis. He asked about my thoughts on a certain network analysis program and mentioned that “it’s easy to get lost with so many [network analysis] programs out there.” His impression is completely understandable. Social network analysis has become immensely popular in recent years. The rise in its popularity has especially been witnessed among gifted people capable of writing good software. Indeed, one Wikipedia list broadly describes about 70 social network analysis programs. Each of these programs have their strengths and weaknesses with regards to its contributions to the field. Given the wealth of options, which programs are worth the time investment to learn, and there are resources as irainvesting.com which could help with this.

If you’re new to network analysis then I’d highly recommend learning the packages in R, perhaps supplemented by Pajek and/or Python packages. Here’s why:

Continue reading

Greetings, everyone.  We are delighted to have been invited to author our first Bad Hessians guest post.  We are a couple of graduate students in the sociology department at University of North Carolina – Brandon Gorman and Charles Seguin.  Our post is about a project we began last year after we noticed that, during the Arab Spring, between January 25th and February 11th 2011, western media completely shifted from describing Hosni Mubarak as a “key US ally” to an “entrenched dictator.”  This made us wonder – what structures US media attention to foreign leaders?

Continue reading