A few months ago I started listening to Tomahawk, a band described on Wikipedia as “an experimental alternative metal/alternative rock supergroup.” Beyond the quality of their music, I found myself intrigued by the musical background of their members. In addition to Tomahawk, their other bands include acclaimed groups such as Faith No More, Helmet, the Melvins, Fantômas, and the Jesus Lizard. Mike Patton alone has been affiliated with at least fifteen bands. Continue reading
Category Archives: Simulation
Lessons on exponential random graph modeling from Grey’s Anatomy hook-ups
I recently discovered Gary Weissman’s excellent post on Grey’s Anatomy Network of Sexual Relations and I felt inspired. For those who haven’t heard of the television show before, Grey’s Anatomy is a widely popular, award-winning prime-time medical drama airing on ABC which has received no shortage of critical acclaim. Meeting conventional medical drama expectations, the show quite regularly features members of its attractive cast “hooking up.” Or so I am told. In an effort to teach medical students some basic social network lessons, Weissman produced a network data set on the show’s sexual contacts between characters. Though I’m not particularly fond of the show and both sexual and fictional networks lie outside my research interests, Weissman’s post served as a remarkable demonstration of network analysis for pedagogical purposes.
the potentially non-existent effect of disaggregation
What do we do when we think that a particular set of effects is likely to vary significantly across groups? There seem to be two basic approaches: we can either (a) run separate models for each group or we can (b) pool data across groups and then allow effects to vary through the inclusion of interaction terms (i.e. run a fully-interacted model). In terms of coefficients, the two approaches will ultimately produce equivalent results.* The standard errors, however, are a different story. This inevitably has implications for things like statistical significance, a subject with which sociologists in particular are known to be preoccupied.
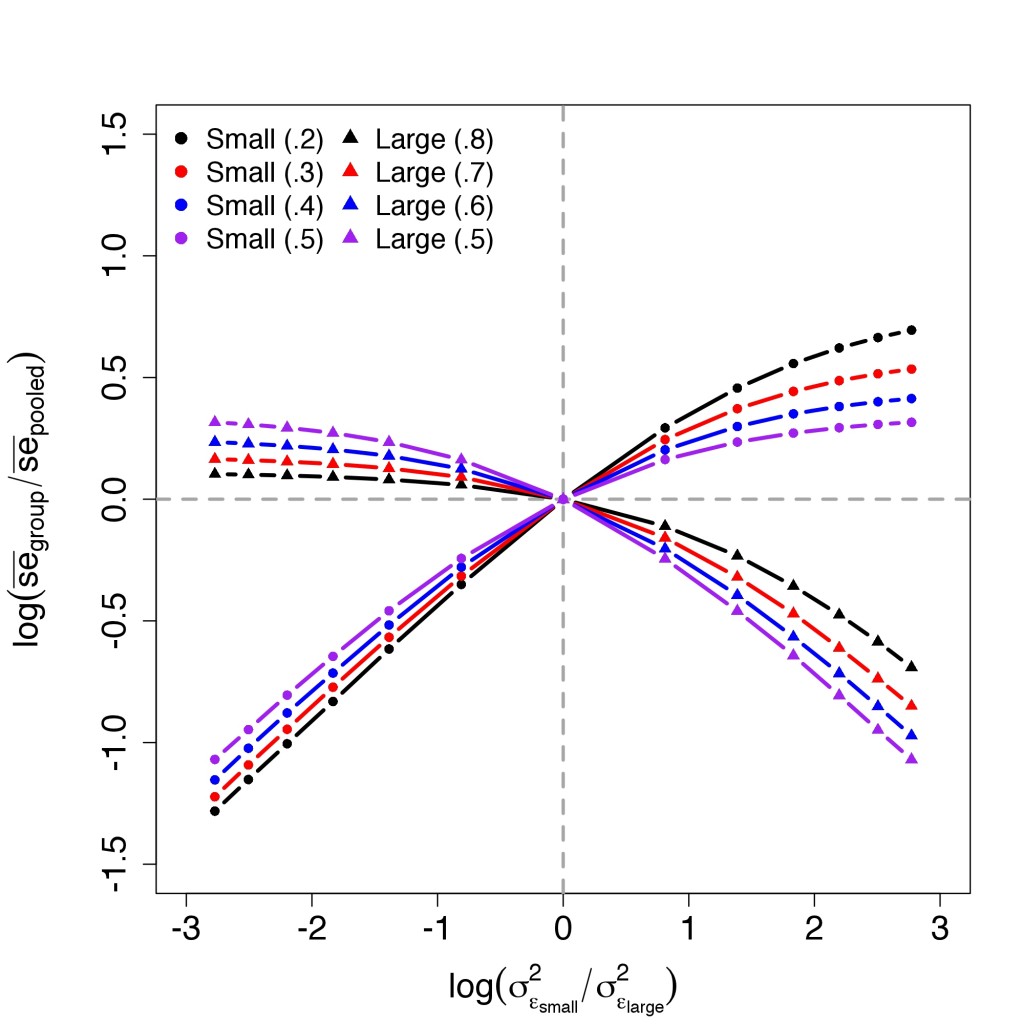
A common intuition is that these changes are due to changes in the degrees of freedom resulting from disaggregation. Having recently run into this suggestion in a couple of different places, I decided to make up some data to get a better sense of how standard errors are affected by groupwise disaggregation (i.e. running separate models for each group as opposed to running a single pooled model with a bunch of interaction effects). I was interested in particular in the way which the expansion and contraction of group-specific standard errors varies depending on differences in group size and error variance. The results of this experiment are shown in the graph below which, in effect, depicts the expansion and contraction of standard errors as a function of the level of groupwise heteroscedasticity. To anticipate the discussion below the break, the main finding here seems to be that, on average, disaggregation has no effect on standard errors in the absence of heteroscedasticity.**

