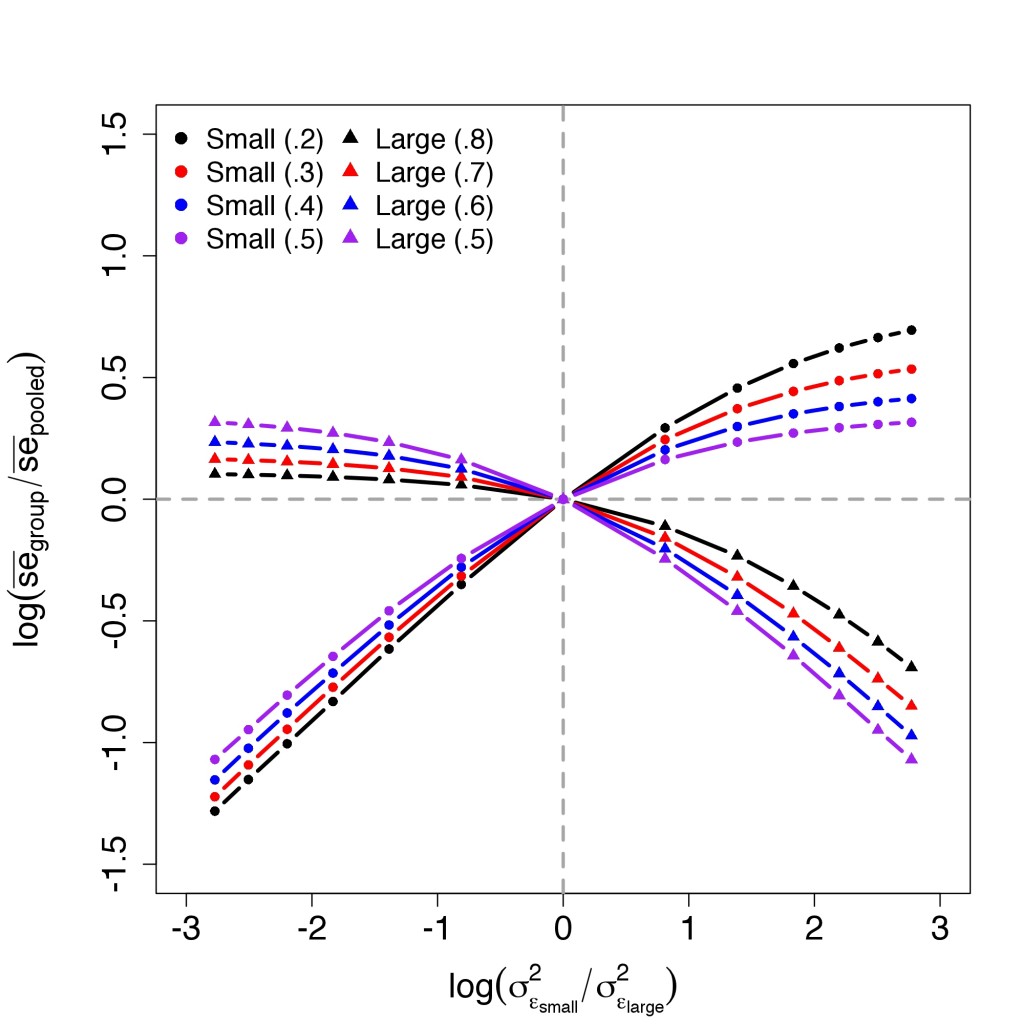
What do we do when we think that a particular set of effects is likely to vary significantly across groups? There seem to be two basic approaches: we can either (a) run separate models for each group or we can (b) pool data across groups and then allow effects to vary through the inclusion of interaction terms (i.e. run a fully-interacted model). In terms of coefficients, the two approaches will ultimately produce equivalent results.* The standard errors, however, are a different story. This inevitably has implications for things like statistical significance, a subject with which sociologists in particular are known to be preoccupied.

A common intuition is that these changes are due to changes in the degrees of freedom resulting from disaggregation. Having recently run into this suggestion in a couple of different places, I decided to make up some data to get a better sense of how standard errors are affected by groupwise disaggregation (i.e. running separate models for each group as opposed to running a single pooled model with a bunch of interaction effects). I was interested in particular in the way which the expansion and contraction of group-specific standard errors varies depending on differences in group size and error variance. The results of this experiment are shown in the graph below which, in effect, depicts the expansion and contraction of standard errors as a function of the level of groupwise heteroscedasticity. To anticipate the discussion below the break, the main finding here seems to be that, on average, disaggregation has no effect on standard errors in the absence of heteroscedasticity.**

Continue reading

Google is back in the news for collecting WiFi data.  As it turns out, the Europeans are really touchy about Google Street View and their private data.  This story started back in 2010, when Google admitted that they were collecting public WiFi information with the same vehicles that drive around the world taking pictures for their Street View and Google Maps applications.  Seemed like a good idea, but multiple European privacy agencies got all bent out of shape.

At first, I was sort of on Google’s side on this one.  It would cool to have a map of WiFi density.  If you read through that blog post from Google, though, you’ll notice that they only meant to collect public information — like the WiFi network name and it’s broadcasting channel — but “mistakingly” collected “samples” of payload data. Huh? I.e. they collected samples of websites that were being visited at unsecured WiFi access points like coffee shops (and if a website had poorly implemented it’s security, they may have collected your personal information, but you can’t really blame Google for that one). That’s creepy.  Google claimed they had deleted all the payload data, but Google maintains a worldwide system of redundant storage servers, and it turns out they didn’t get it all deleted.

So I’m not on Google’s side anymore.  They may be making a good faith effort to make this right, or they may be running a test program to identify which coffee shops slant towards Facebook or Google Plus usage.  Such a program wouldn’t be evil, per se, but it would highly unethical. The whole episode brought to mind an article from four years ago where a geographer used basically the same procedure to measure WiFi density in and around Salt Lake City:

Torrens, P. M. 2008. Wi-Fi geographies. Annals of the Association of American Geographers 98:59-84.

For those of you without access to academic libraries, you can get a pretty good flavor of his research from this website, and here’s the punchline:
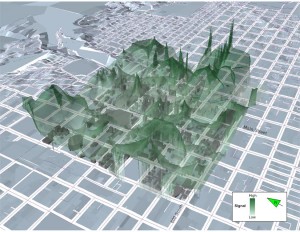
Salt Lake City WiFi Density

Torrens briefly addressed the issue of private/public space and legalities of collecting his data:

Most computer networks use IP to disassemble and reconstitute data as they are conveyed across networks and routers. Wi-Fi beacon frames essentially advertise the presence of the access point to clients in the surrounding environment and ensure that it is visible (in spectrum space) to many devices. Because they do not actually carry any substantive data from users of the network (their queries to a search engine, for example), it is legal to capture beacon frames. (p. 66)

Two questions: 1) What is the line between the data that is legal to collect and that which is illegal? And are researchers obligated to follow international standards or their home nation’s laws? and 2) Has a human subjects review board ever considered this issue?  For example Madison, Wisconsin has a downtown wireless network that sells subscription service. It seems like a valid research question in communications geography to figure out which one of their access points have traffic, during which times of day, the distribution of laptops and smart phones, etc. Could I sample payload data if I just used it to collect presence/absence of users? and cross-my-heart promised to delete the raw data?

Looking around the University of Wisconsin’s IRB website I couldn’t find any memos about collecting ambient wireless signals. And their summary of exempt research might imply that WiFi data collection would be exempt based on its “public” nature, but it’s less clear if it is truly de-identified because Google and Torrens were collecting MAC addresses and SSIDs.  True, that’s not like storing a person’s name, but IRB standards generally hold that street addresses are identifying data.  The relevant guidelines from the Wisconsin policy on exempt research:

Research involving the collection or study of existing data, documents, records, pathological specimens, or diagnostic specimens, if these sources are publicly available or if the information is recorded by the investigator in such a manner that subjects cannot be identified, directly or through identifiers linked to the subjects.

Hm, I don’t know.


I briefly talked about GitHub, the version control system, in my last post on taking notes in Markdown. A few days ago John Norman wrote a post, calling GitHub “the most important social network“. He says this by virtue of discussion features built into the system, discussions can occur around code and changes can be incorporated rather easily. But the more intriguing part of his discussion, I think, lies at the potential of changing the nature of knowledge production, not only for code:

Let me tell you about knowledge production: much of it is private. I have a PhD in English and wrote a dissertation on the interaction between literary and medical knowledge in the sixteenth and seventeenth centuries. My research notes and revisions were essentially private. My drafts were my property. In certain highly ceremonial performances, I might share my “work in progress” with an individual (a faculty advisor or an eminent scholar or a friend who could provide feedback), or with a study group interested in the project, or from the lectern at a conference. But for the most part, sharing to the entire world happened at the moment of final “production,” when the artifact was safely ensconced in the library or computer, and indexed by domain experts. This pattern is much the same in the social sciences and the sciences (the sciences are circulating more papers in pre-publication form, but the door is closed to full access to the laboratory).

This is actually a very intriguing prospect for me. Is there the potential to share and think through research notes in the actual process of writing them up? Does the same kind of system hold promise for writing articles and research reports? And are scholars willing to show that much of their Goffmanian “back stage” to public audiences?

As a token of my commitment to this experiment, here are my own notes for the prelim exam I’m studying for. http://github.com/raynach/comparative-historical. I have a number of apprehensions about doing this but I am very curious about the degree to which we can bring the collaboration of open-source code projects to other domains of knowledge production.

What other projects could social scientists use version control systems for?

We’re really excited to launch a new portion of the site today, what we are calling Ask the Bad Hessians. The name is a bit of a misnomer — it’s actually a crowdsourced site in which anyone can ask — and answer — the questions posted there. If you are familiar with Stack Overflow, the software we’re using is a clone of that. When you post a question, anybody can reply with an answer to it. Answers are voted “up” or “down” by other users, and the original asker can pick what s/he deems as the correct answer.

Stack Overflow is where I know I go for a bunch of my own programming questions, and from my conversations with Adam and Trey I know they do as well. We hope this can be as useful as a resource for social scientists. Feel free to ask questions about Stata, surveys, R, LaTeX, data cleaning, etc etc. Someone’s gotta have an answer, right?

Most of the spatial data I work with begins its life as a shapefile. While there are a number of tools available for dealing with shapefiles in R, it is often easier to work in dedicated geographic information system (GIS) software such as ArcMap which is now almost exclusively oriented towards Python-based scripting. With a little help from Alex, I’ve managed to get my head wrapped around Python. The problem is that I now find myself running multiple scripts in multiple languages. When I’m writing code for personal consumption this isn’t really a problem. What usually happens is that I end up running the scripts in the wrong order and I have to start over. When it comes to providing to code to others, however, I am wary of anything that might lead to unintended errors. Consequently, I began looking into ways into which I could better integrate the Python-based scripts I use to work with geographic data with the R-based scripts I use to handle data analysis.

Perhaps the most elegant solution is to use something like RPy. I started down this road while working at home on a MacBook Pro only to have it all fall apart when I got to work where I am on a Windows-based system which isn’t compatible with either rpy or rpy2. As it turns out, the system command in R served as a viable work-around. More specifically, instead of writing a single script in Python using some variant of RPy, I wrote a master script in which I use the system command to call a separate .py file which generates shapefiles that can then be read and analyzed in R. This is basically a modification of a trick I’ve used in the past for organizing .tex files in my dissertation and .do files in Stata. The key difference is that so long as the scripts in questions can executed via the command line, it is relatively easy to use R to organize processes working across multiple platforms. I’d be interested to hear what other solutions people have come up with for dealing with this type of problem. Even if it is an ordinary conversion like pdf to word.

In a previous post I made a reference to the estimation of equilibrium effects in the context of a spatial lag model. This is a question which has received surprisingly little attention given that the standard approach to interpreting parameter estimates is generally inapplicable in this setting. The problem is that in a spatial lag model, the effect of any given variable depends on the structure of geographic relationships in the underlying data. To the extent that these relationships vary across observations, the relationship between some independent variable x and some dependent variable y varies across observations as well.
Continue reading

I’m taking a preliminary exam in about a month so I’m very much embedded in the classics of comparative-historical sociology, as well as more recent revisionist works. As such I haven’t been able to dirty up with my usual nerdery.

But I do tend to have a somewhat unorthodox approach to taking notes, partially inspired by my avoidance of anything formatted in Word, partially rooted in my love of emacs (sorry vi fans). I wanted a lightweight syntax (read, in plain text) for keeping notes that wouldn’t get outdated quickly and wasn’t just some terrible hack that I threw together but wouldn’t understand down the line.

Enter Markdown. Markdown is a simple syntax that stores in plain-text and converts to valid HTML. It allows you to created ordered and unordered lists, define bold and italic words, headings and subheadings, and all other nifty features. What I really like about Markdown is that it makes it very easy to take outlines written in any text editor and turn them into attractive, easy-to-read webpages. It’s flexible enough to work on any computer and quick enough to use in lecture without having to fudge with formatting and idiosyncratic word processor errors.
Continue reading

Loops are great. They save us lots of work and they solve all sorts of problems. Sometimes, however, there are better ways of going about things. In the first place, we are often using loops to implement matrix operations. This is important to keep in mind when working in a language such as R which allows you to handle matrices directly. Loops can also be memory-intensive, hence why R gurus tend to encourage the use of apply-style functions whenever possible. These points can be illustrated by working through the following:
Continue reading

Do you ever find yourself asking yourself questions like…

  • What the hell is a Hessian and how do I get R to invert it?
  • How do I gather mass quantities of Twitter data in real-time? [then later] Whoa, what the crap do I do with 12 million tweets?
  • What does a freaking “KeyError” mean, Python?

These are the kinds of questions which plague us. Bad Hessian is a blog dedicated to the nerdiest details of quantitative and computational social science. We have plenty of questions and maybe even a few answers. At the very least we have lots of code.