
This is not a post about Nate Silver. I promise. One of the more interesting and well-covered stories of the 2012 US Elections was the so-called “quants vs. pundits” debate that focused–unfairly, given the excellent models developed by Sam Wang, Drew Linzer, and Simon Jackman–on Nate Silver’s Five Thirty Eight forecasting model. I follow a number of social scientists on Twitter and many of their reactions to the success of these models followed along the lines of “YEAH! SCIENCE!” and “+1 for the quants!” and so on. There seemed to be real joy (aside from the fact that many of these individuals were Obama supporters) in the growing public recognition that quantitative forecasting models can produce valid results.
Continue reading
Category Archives: General
The New Secessionists
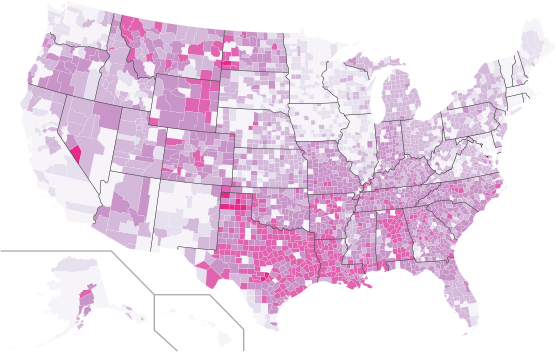
Signers to White House secession petitions by county. Color based on proportion of residents signing, with darker colors showing higher levels of secession support. Current as of 1am on Thurday, November 15th. Click here for an interactive version.
Since Election Day, more than 60 petitions have been posted on the White House’s website requesting that states be allowed to withdraw from the United States and create their own government. As of November 13, 2012, the following states had active petitions: Alabama, Alaska, Arizona, Arkansas, California, Colorado, Delaware, Florida, Georgia, Idaho, Illinois, Indiana, Kansas, Kentucky, Louisiana, Michigan, Minnesota, Mississippi, Missouri, Montana, Nebraska, Nevada, New Hampshire, New Jersey, New Mexico, New York, North Carolina, North Dakota, Ohio, Oklahoma, Oregon, Pennsylvania, Rhode Island, South Carolina, South Dakota, Tennessee, Texas, Utah, Virginia, Virginias, West Virginia, Wisconsin, and Wyoming.
While petitions are focused on particular states, signers can be from anywhere. In order to show where support for these secession was the strongest, a graduate seminar on collecting and analyzing and data from the web in the UNC Sociology Department downloaded the names and cities of each of the petition signers from the White House website, geocoded each of the locations, and plotted the results.
In total, we collected data on 764,387 signatures. Of these, we identified 270,610 unique combinations of names and places, suggesting that a large number of people were signing more than one petition. Approximately 90%, or 244,001, of these individuals provided valid city locations that we could locate with a US county.
The above graphic shows the distribution of these petition signers across the US. Colors are based proportion of people in each county who signed.
We also looked at the distribution of petition signers by gender. While petition signers did not list their gender, we attempted to match first names with Social Security data on the relative frequency of names by sex. Of the 242,823 respondents with gendered names, 62% had male names and 38% had female names. This 24 point gender gap is twice the size of the gender gap for voters in the 2012 Presidential election.
Tools: Python, Yahoo Geocoding API, and Pete Skomoroch’s remix of Nathan Yau’s county thematic map script.
Neal Caren, Ali Eshraghi, Sarah Gaby, Brandon Gorman, Michael Good, Jonathan Horowitz, Ali Kadivar, Rachel Ramsay, Charles Seguin, and Didem Turkoglu.
Note: This is a repost from the original at http://www.unc.edu/~ncaren/secessionists/ the map at the original site is interactive, but I’ve had trouble adding that functionality here. We reposted to make this Bad Hessians Official. Thanks to the Bad Hessians for having us on as guests.
Python, Hadoop Streaming, and Twitter analysis
Over the weekend I led a workshop on basic Twitter processing using Hadoop Streaming (or at least simulating Hadoop Streaming). I created three modules for it.
The first is an introduction of MapReduce that calculates word counts for text. The second is a (very) basic sentiment analysis of political tweets, and the last one is a network analysis of political tweets.
All the code for these workshops is on the site. What other kinds of analysis can/should be done with Twitter data?
Python for network analysis
Following up on the string of posts about software for network analysis, I recently taught a workshop for PhD students in the social sciences here at Stanford on using Python for network analysis. My session was part of a three day series of workshops introducing computational social science to students who are looking to get their feet wet. I’m posting a link (here) to the page on my website where you can download the materials I developed to teach the workshop, including commented scripts, sample datasets, and a few slides.
Some brief impressions: I’ve taught stats/methods for grad students before, but this was a different beast. Computational social science and network analysis are attractive areas for many grad students here, but without a ‘canon’ of some type to fall back on, it’s hard to know what to emphasize for students with little background. I ended up focusing more basic data and control structures in Python, which I thought would be more useful for understanding the way the networkx package handles inputs and outputs. I’m not sure that was the most effective approach, though–at least in terms of conveying why Python is a good choice for network analysis. Next time, I think I’ll try to integrate more substantive examples.
Also, inspired by Ben’s last post–maybe we should put a few network analysis packages to a speed test? I get this question all the time, and I usually just refer to my own anecdotal evidence, but it’s probably worth pitting iGraph, networkx, etc. across platforms against one another in calculating, say, shortest paths in a relatively large network. More on this later…
P.S. It’s only taken me 3 months to write my first post!
The distribution of US media attention to foreign leaders: 1950-2008
Greetings, everyone. We are delighted to have been invited to author our first Bad Hessians guest post. We are a couple of graduate students in the sociology department at University of North Carolina – Brandon Gorman and Charles Seguin. Our post is about a project we began last year after we noticed that, during the Arab Spring, between January 25th and February 11th 2011, western media completely shifted from describing Hosni Mubarak as a “key US ally” to an “entrenched dictator.” This made us wonder – what structures US media attention to foreign leaders?
Text normalization and Arabic in R
Working with right-to-left languages like Arabic in R can be a bit of a headache, especially when mixed with left-to-right languages (like English). Since my research involves a great deal of text analysis of Arabic news articles, I find myself with a lot of headaches. Most text analysis methods require some kind of normalization before diving into the actual analyses. Normalization includes things like removing punctuation, converting words to lowercase, stripping numbers out, and so on. This is essential for any kind of frequency-based analysis so that words such as don’t, Don’t, and dont are not considered unique words. After all, when dealing with human-generated text, typos and differences in presentation are bound to occur. Often times, normalizing also includes stemming words so that words such as think, thinking, and thinks are all stemmed to “think” as they all represent (basically) the same concept.
#ASA2012 Computational Social Science Shindig!
Going to be at ASA? Come hang out with the Bad Hessians!
Friday, August 17, 8 PM.
Euclid Hall Bar & Kitchen, 1317 14th Street
RSVP on the Facebooks

WiFi and IRB
Google is back in the news for collecting WiFi data. As it turns out, the Europeans are really touchy about Google Street View and their private data. This story started back in 2010, when Google admitted that they were collecting public WiFi information with the same vehicles that drive around the world taking pictures for their Street View and Google Maps applications. Seemed like a good idea, but multiple European privacy agencies got all bent out of shape.
At first, I was sort of on Google’s side on this one. It would cool to have a map of WiFi density. If you read through that blog post from Google, though, you’ll notice that they only meant to collect public information — like the WiFi network name and it’s broadcasting channel — but “mistakingly” collected “samples” of payload data. Huh? I.e. they collected samples of websites that were being visited at unsecured WiFi access points like coffee shops (and if a website had poorly implemented it’s security, they may have collected your personal information, but you can’t really blame Google for that one). That’s creepy. Google claimed they had deleted all the payload data, but Google maintains a worldwide system of redundant storage servers, and it turns out they didn’t get it all deleted.
So I’m not on Google’s side anymore. They may be making a good faith effort to make this right, or they may be running a test program to identify which coffee shops slant towards Facebook or Google Plus usage. Such a program wouldn’t be evil, per se, but it would highly unethical. The whole episode brought to mind an article from four years ago where a geographer used basically the same procedure to measure WiFi density in and around Salt Lake City:
Torrens, P. M. 2008. Wi-Fi geographies. Annals of the Association of American Geographers 98:59-84.
For those of you without access to academic libraries, you can get a pretty good flavor of his research from this website, and here’s the punchline:

Torrens briefly addressed the issue of private/public space and legalities of collecting his data:
Most computer networks use IP to disassemble and reconstitute data as they are conveyed across networks and routers. Wi-Fi beacon frames essentially advertise the presence of the access point to clients in the surrounding environment and ensure that it is visible (in spectrum space) to many devices. Because they do not actually carry any substantive data from users of the network (their queries to a search engine, for example), it is legal to capture beacon frames. (p. 66)
Two questions: 1) What is the line between the data that is legal to collect and that which is illegal? And are researchers obligated to follow international standards or their home nation’s laws? and 2) Has a human subjects review board ever considered this issue? For example Madison, Wisconsin has a downtown wireless network that sells subscription service. It seems like a valid research question in communications geography to figure out which one of their access points have traffic, during which times of day, the distribution of laptops and smart phones, etc. Could I sample payload data if I just used it to collect presence/absence of users? and cross-my-heart promised to delete the raw data?
Looking around the University of Wisconsin’s IRB website I couldn’t find any memos about collecting ambient wireless signals. And their summary of exempt research might imply that WiFi data collection would be exempt based on its “public” nature, but it’s less clear if it is truly de-identified because Google and Torrens were collecting MAC addresses and SSIDs. True, that’s not like storing a person’s name, but IRB standards generally hold that street addresses are identifying data. The relevant guidelines from the Wisconsin policy on exempt research:
Research involving the collection or study of existing data, documents, records, pathological specimens, or diagnostic specimens, if these sources are publicly available or if the information is recorded by the investigator in such a manner that subjects cannot be identified, directly or through identifiers linked to the subjects.
Hm, I don’t know.
Announcing “Ask the Bad Hessians”!
We’re really excited to launch a new portion of the site today, what we are calling Ask the Bad Hessians. The name is a bit of a misnomer — it’s actually a crowdsourced site in which anyone can ask — and answer — the questions posted there. If you are familiar with Stack Overflow, the software we’re using is a clone of that. When you post a question, anybody can reply with an answer to it. Answers are voted “up” or “down” by other users, and the original asker can pick what s/he deems as the correct answer.
Stack Overflow is where I know I go for a bunch of my own programming questions, and from my conversations with Adam and Trey I know they do as well. We hope this can be as useful as a resource for social scientists. Feel free to ask questions about Stata, surveys, R, LaTeX, data cleaning, etc etc. Someone’s gotta have an answer, right?
There were over 50 warnings (use warnings() to see them)
Do you ever find yourself asking yourself questions like…
- What the hell is a Hessian and how do I get R to invert it?
- How do I gather mass quantities of Twitter data in real-time? [then later] Whoa, what the crap do I do with 12 million tweets?
- What does a freaking “KeyError” mean, Python?
These are the kinds of questions which plague us. Bad Hessian is a blog dedicated to the nerdiest details of quantitative and computational social science. We have plenty of questions and maybe even a few answers. At the very least we have lots of code.