If you’re looking for a good outlet for some computationally-oriented social science work, check out the International Conference on Computational Social Science (IC^2S^2). (Disclaimer: I am on the program committee for this conference). Last year, as the Computational Social Science Summit, the conference attracted 200 participants and had a very vibrant set of panels.

Abstracts are due on January 31, 2016. Hoping to see many of you there!

[Note: I do realize that this event was nearly two months ago. I have no one to blame but the academic job market.]

On August 15 and 16, we held the first annual ASA Datathon at the D-Lab at Berkeley. Nearly 25 people came from academia, industry, and government participated during the 24-hour hack session. The datathon focused on open city data and methods, and questions surrounded issues such as gentrification, transit, and urban change.

Two of our sponsors kicked off the event by giving some useful presentations on open city data and visualization tools. Mike Rosengarten from OpenGov presented on OpenGov’s incredibly detailed and descriptive tools for exploring municipal revenues and budgets. And Matt Sundquist from plot.ly showed off the platform’s interactive interface which works across multiple programming environments.

Fueled by various elements of caffeine and great food, six teams hacked away through the night and presented their work on the 16th at the Hilton San Francisco. Our excellent panel of judges picked the three top presentations which stood out the most:

Honorable mention: Spurious Correlations

The Spurious Correlations team developed a statistical definition for gentrification and attempted to define which zip codes had been gentrified by their definition. Curious about those doing the gentrifying, they asked if artists acted as “middle gentrifiers.” While this seemed to correlate in Minneapolis, it didn’t hold for San Francisco.

Second place: Team Vélo 

Team Vélo, as the name implies, was interested in bike thefts in San Francisco and crime in general. They used SFPD data to rate crime risk in each neighborhood and tried to understand which factors may be influencing crime rates, including racial diversity, income, and self-employment.

First place: Best Buddies Bus Brigade

Lastly, our first place winners asked “Does SF public transportation underserve those in low-income communities or without cars?” Using San Francisco transit data, they developed a visualization tool to investigate bus load and how this changes by location, conditional on things like car ownership.

You can check out all the presentations at the datathon’s GitHub page.

Laura Nelson, Laura Norén, and I want to give a special thanks to our sponsors: OpenGov, UC Berkeley Sociology, UW Madison Sociology, the D-Lab, SurveyGizmo, the Data Science Toolkit, Duke Network Analysis Center, plot.ly, orgtheory, Fabio Rojas, Neal Caren, and Pam Oliver.

As ASA gets closer, so does the first ASA Datathon!

We’re on from 1pm August 15 through 1pm the 16th at Berkeley’s D-Lab. Public presentations and judging will take place at one of the ASA conference hotels, the Hilton Union Square, Room 3-4, Fourth Floor from 6:30-8:15 on August 16th.

We’ve got a new website up — asa-datathon.github.io — that’ll be updated as the event approaches. If you haven’t signed up yet, make sure you do!

Signing up will give us a better idea of who will be at the event and how many folks we can expect to feed and caffinate. We’re also going to give teams a week to get to know each other before the event, so signing up will allow us to make sure everyone gets the same amount of time to work.

If you’re interested, you are invited. We don’t discriminate against particular methodologies or backgrounds. We hope to have social scientists, data scientists, computer scientists, municipal staffers, start-up employees, grad students, and data hackers of all stripes – quantitative, qualitative, and the methodologically agnostic.

Continue reading

I’m really excited to officially announce the first annual pre-ASA datathon, taking place at Berkeley’s D-Lab on August 15-16, 2014.

The theme is “big cities, big data: big opportunity for computational social science,” the idea being looking at contemporary urban issues — especially housing challenges — using data gathered and made publicly available by cities including San Francisco, New York, Chicago, Austin, Boston, Somerville, Seattle, etc.

The hacking will start at noon on August 15 and go until the next day. Sleeping is optional. We’ll have a presentation and judging session in the evening of August 16 in San Francisco, exact location TBD.

We’re working with several academic and industry partners to bring together tools and datasets which social scientists can use at the event. So stay tuned as that develops.

You can apply here and see the full call [PDF].

ALSO — Check out the CITASA Symposium the morning of the 15th (citasasymposium.info) before joining us at noon for the Datathon! There’ll be a number of great talks which will complement the hacking over at the D-Lab.

This is a guest post by Karissa McKelvey. She has a BA in Computer Science and Political Science from Indiana University. After graduating, she worked as a research assistant at the Center for Complex Networks and Systems Research at Indiana University on an NSF grant to analyze and visualize the relationship between social media expressions and political events. She is an active contributor to open source projects and continues to publish in computer supported cooperative work and computational social science venues. She currently works as a Software Engineer at Continuum Analytics.

Imagine you are a graduate student of some social or behavioral science (not hard, I assume). You want to collect some data: say I’m going to study the fluctuation of value of products over time on Craiglist, or ping the Sunlight Foundation’s open government data, or use the GDELT to study violent political events. There are a variety of tools I may end up using for my workflow:

  1. Retrieving the data: Python, BeautifulSoup
  2. Storing the data: CSV, Json, MySQL, MongoDB, bash
  3. Retrieving this stored data: SQL, Hive, Hadoop, Python, Java
  4. Manipulating the data: Python, CSV, R
  5. Running regressions, simulations: R, Python, STATA, Java
  6. Presenting the data: R, Excel, Powerpoint, Word, LaTeX

My workflow for doing research now requires a variety of tools, some of which I might have never used before. The number of tools I use seems to scale with the amount of work I try to accomplish. When I encounter a problem in my analysis, or can’t reproduce some regression or simulation I ran, what happened? Where did it break?

Should it really be this difficult? Should I really have to learn 10 different tools to do data analysis on large datasets? We can look at the Big Data problem in a similar light as surveys and regression models. According to IT companies such as Mustard IT, the largest and most fundamental part of the equation is just that this stuff is new – high-priority and well thoughout workflows have yet to be fully developed and stablized.

What if I told you that you could do all of this with the fantastically large number of open source packages in Python? In your web browser, on your iPad?

Continue reading

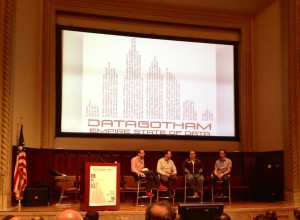
datagothamThis is a guest post by Sean J. Taylor, a PhD student in Information Systems at NYU’s Stern School of Business.

Last Thursday and Friday I attended the 2nd annual DataGotham conference in New York City. Alex Hanna asked me to write about my experience there for the benefit of those who were unable to attend, so here’s my take on the event.

Thursday evening was a social event in a really sweet rooftop space in Tribeca with an open bar and great food (a dangerous combination for this still-grad-student). Though I spent a lot of the time catching up with old friends, I would describe the evening as “hanging out on Twitter, but in person.” I met no fewer than a dozen people I had only previously known online. I am continually delighted at how awesomeness on Twitter is a reliable indicator of awesomeness in-person. Events like DataGotham are often worth it for this reason alone.

Continue reading

UPDATE 2013-10-01: Nate Porter pointed out that the Hacker League page doesn’t let you sign up. For now, use this Google doc.

A lot of folks on Twitter during ASA this year were chatting about the possibility of a hackathon during ASA 2014 in San Francisco. The reasons for having a hackathon, I think, are myriad; here are some of the various “purposes” that myself and members of the computational sociology listserv have considered:

  • Incorporate computational methods into social science through teh h4x
  • Inspire participants to apply computational methods to common social science problems
  • Create an organizational nexus for computational sociology which makes it a vibrant and visible part of the discipline
  • Develop and foster social ties that strengthen the field and point to the value of non-traditional venues for collaboration
  • Create useful and interesting research products.
  • Solidify connections among sub-community of folks in/around sociology who have a set of skills/tools/interests in things computational
  • Increase visibility of that sub-community, partly by showcasing what can be done
  • To support claim that sociology has a role to play in computational social science and that computation has a role to play in sociology.
  • Connect folks already immersed in these skill areas with folks who are around the edges, curious, etc.
  • To actually impart some new skills/ideas to folks.
  • To actually produce something collectively useful.
  • To lay foundation for something that could grow in future years at ASA meetings or in ASA in general (e.g., a network of folks working with these tools).

I’m really excited about the prospect of this. Laura NorénChristopher Weiss, and I have been plotting to make this thing a reality. Right now we’re trying to gauge how many people would come out to such an event.

If you have even a tiny inkling that you might come to the hackathon, sign up at the Hacker League page.

As mentioned in a previous post, Alex Hanna and I had the opportunity to teach last week at the Higher School of Economic’s International Social Network Analysis Summer School in St. Petersburg.  While last year’s workshop emphasized smaller social networks, this year’s workshop focused on online networks.  For my part, I provided an introductory lecture to social network analysis along with four labs on the subject of R and social network analysis.

The introduction to social network analysis began with an historical overview, followed by outlining which concepts constitute a social network.  The remaining portions review subjects relating to subgraphs, walks, centrality, cohesive subgroups, along with major research subjects in the field.  Setting aside the substantive interest in networks, the first lab covered basic R usage, objects, and syntax.   Admittedly, this material was relatively dryer, though necessary to make the most of the network analysis software in R.  We followed this introduction to R with an introduction to R’s social network analysis software.  This second lab introduces the class to the different network packages within R, reading data, basic measurements brought up in the introductory lecture, and visualization.  The third R SNA lab was on the subject of graph-level indices, random graphs, and Conditional Uniform Graph tests.  Both the second and third labs were conducted primarily using the igraph package.  The fourth and final lab of the course was on the subject of exponential random graph modeling.  For this lab, we walked through tests for homophily and edgewise-shared partner effects using data on both our Twitter hashtag (#SNASPb2013) as well as US political blogs.

The slides include scripts that download and read the data used within all lab examples.

I’ve hosted PDFs of all the slides on Google Drive.

The ASA annual meeting starts on Friday, and the program is about 200 pages long. But don’t worry, we’ve got you covered. Here’s a few computational sociology events that you should catch, suggested by folks on the computational sociology listserv.

If you know of any more that look interesting, feel free to post them in the comments and I’ll add them to this Google Calendar.