
I’ve been using R for years and absolutely love it, warts and all, but it’s been hard to ignore some of the publicity the Julia language has been receiving. To put it succinctly, Julia promises both speed and intuitive use to meet contemporary data challenges. As soon as I started dabbling in it about six months ago I was sold. It’s a very nice language. After I had understood most of the language’s syntax, I found myself thinking “But can it do networks?” As it stands, there’s currently one library, Graphs, that addresses networks. Relative to R’s network packages, Graphs.jl has a very slick way of storing network data . Wasserman and Faust (1994) define a network as a set of actors and the set of the relationships between them–Graphs.jl reminds users of this conceptualizaton. Unlike R, Julia requires that users actively consider data types, so naturally, each actor in a network is represented by an object of type “KeyVertex” or “ExVertex.” The difference between these two vertex types is whether or not actors need attributes and labels. Should an actor have a label and attributes, this information is stored within each ExVertex object within a network. A relationship between two actors is likewise represented by an object of type “Edge” or “ExEdge” (again, differing based upon whether or not the edge can store an attribute). Creating an edge object requires a user to specify the sending and receiving vertices, expressed as vertex objects. In short, each network is represented by an array of vertices of a particular type as well as an array of edges of a particular type. Once the user has decided upon the types of vertices in her network, she must then create the vertex objects, include them in her network or “graph,” create edge objects that include pairs of vertex objects, then include those edges in her graph as well. After the user has created a graph object, she can then easily retrieve the vertex and edge objects along with any attributes they might have. After I create a network data object, I typically want to visualize it immediately. Unfortunately, for now the functionality in Graphs.jl is quite limited compared to igraph and the statnet suite in R. As it stands, there are no network visualization functions and just one layout function (random). Because Graphs.jl is relatively young and the developers are busy contributing to many of Julia’s other libraries, this limitation is to be expected. Nevertheless, I’ve been itching to make a network plot in Julia so I decided to write up a function. Network plotting functions need to accept a few traditional arguments. First, they obviously need to accept a network/graph object. Second, they need the ability to express vertex and edge attributes through varying colors, shapes, and sizes. Third, edge directionality needs to be indicated, should it exist. As a matter of personal preference, I find that opacity can be a useful visualization tool and that intensity-tapered-curved edges are a good way to portray directionality. The defaults should also not be fugly. Julia has a few visualization tools and for this project I decided to render the networks in plot.ly. Plot.ly has a few benefits over the other packages in Julia in that it stores the visualizations and data online, it allows collaboration, and the platform is also accessible through R, MATLAB, and Python. If network diagrams are basically many line and scatter plots, then, in theory, plot.ly should have no trouble rendering network visualizations. To demonstrate, let’s do a “Hello, world” with Padgett’s Florentine family marriage network. Here, marriage is an undirected relationship, the labels are meaningful, and we’re omitting the other attributes. For the data examples here, I’ve cheated a bit and calculated the vertex layout in igraph for R, but the rest was done in Julia. After starting Julia, you’ll need to load the data and plotting function, then you’ll need to enter your own plot.ly user name and API key, and lastly run the function.
-
download(“http://pastebin.com/raw.php?i=Z2t7XRd3”, “GraphsPopularDataSets.jl”)
-
include(“GraphsPopularDataSets.jl”)
-
rm(“GraphsPopularDataSets.jl”)
- download(“http://pastebin.com/raw.php?i=ymrmxPtU”, “Sociogram–graph_plotly.jl”)
- include(“Sociogram–graph_plotly.jl”)
- rm(“Sociogram–graph_plotly.jl”)
-
# See https://plot.ly/julia/getting-started
-
yourplotlyname = “Not this string”
-
yourplotlyAPIkey = “Not this string, either”
-
floplot = graph_plotly(flograph, yourplotlyname, yourplotlyAPIkey, vertexsize = 0.75, label = true)
-
println(floplot[“url”]) #Find the plot at this URL
Going to that URL, you should see a plot that looks like this one: 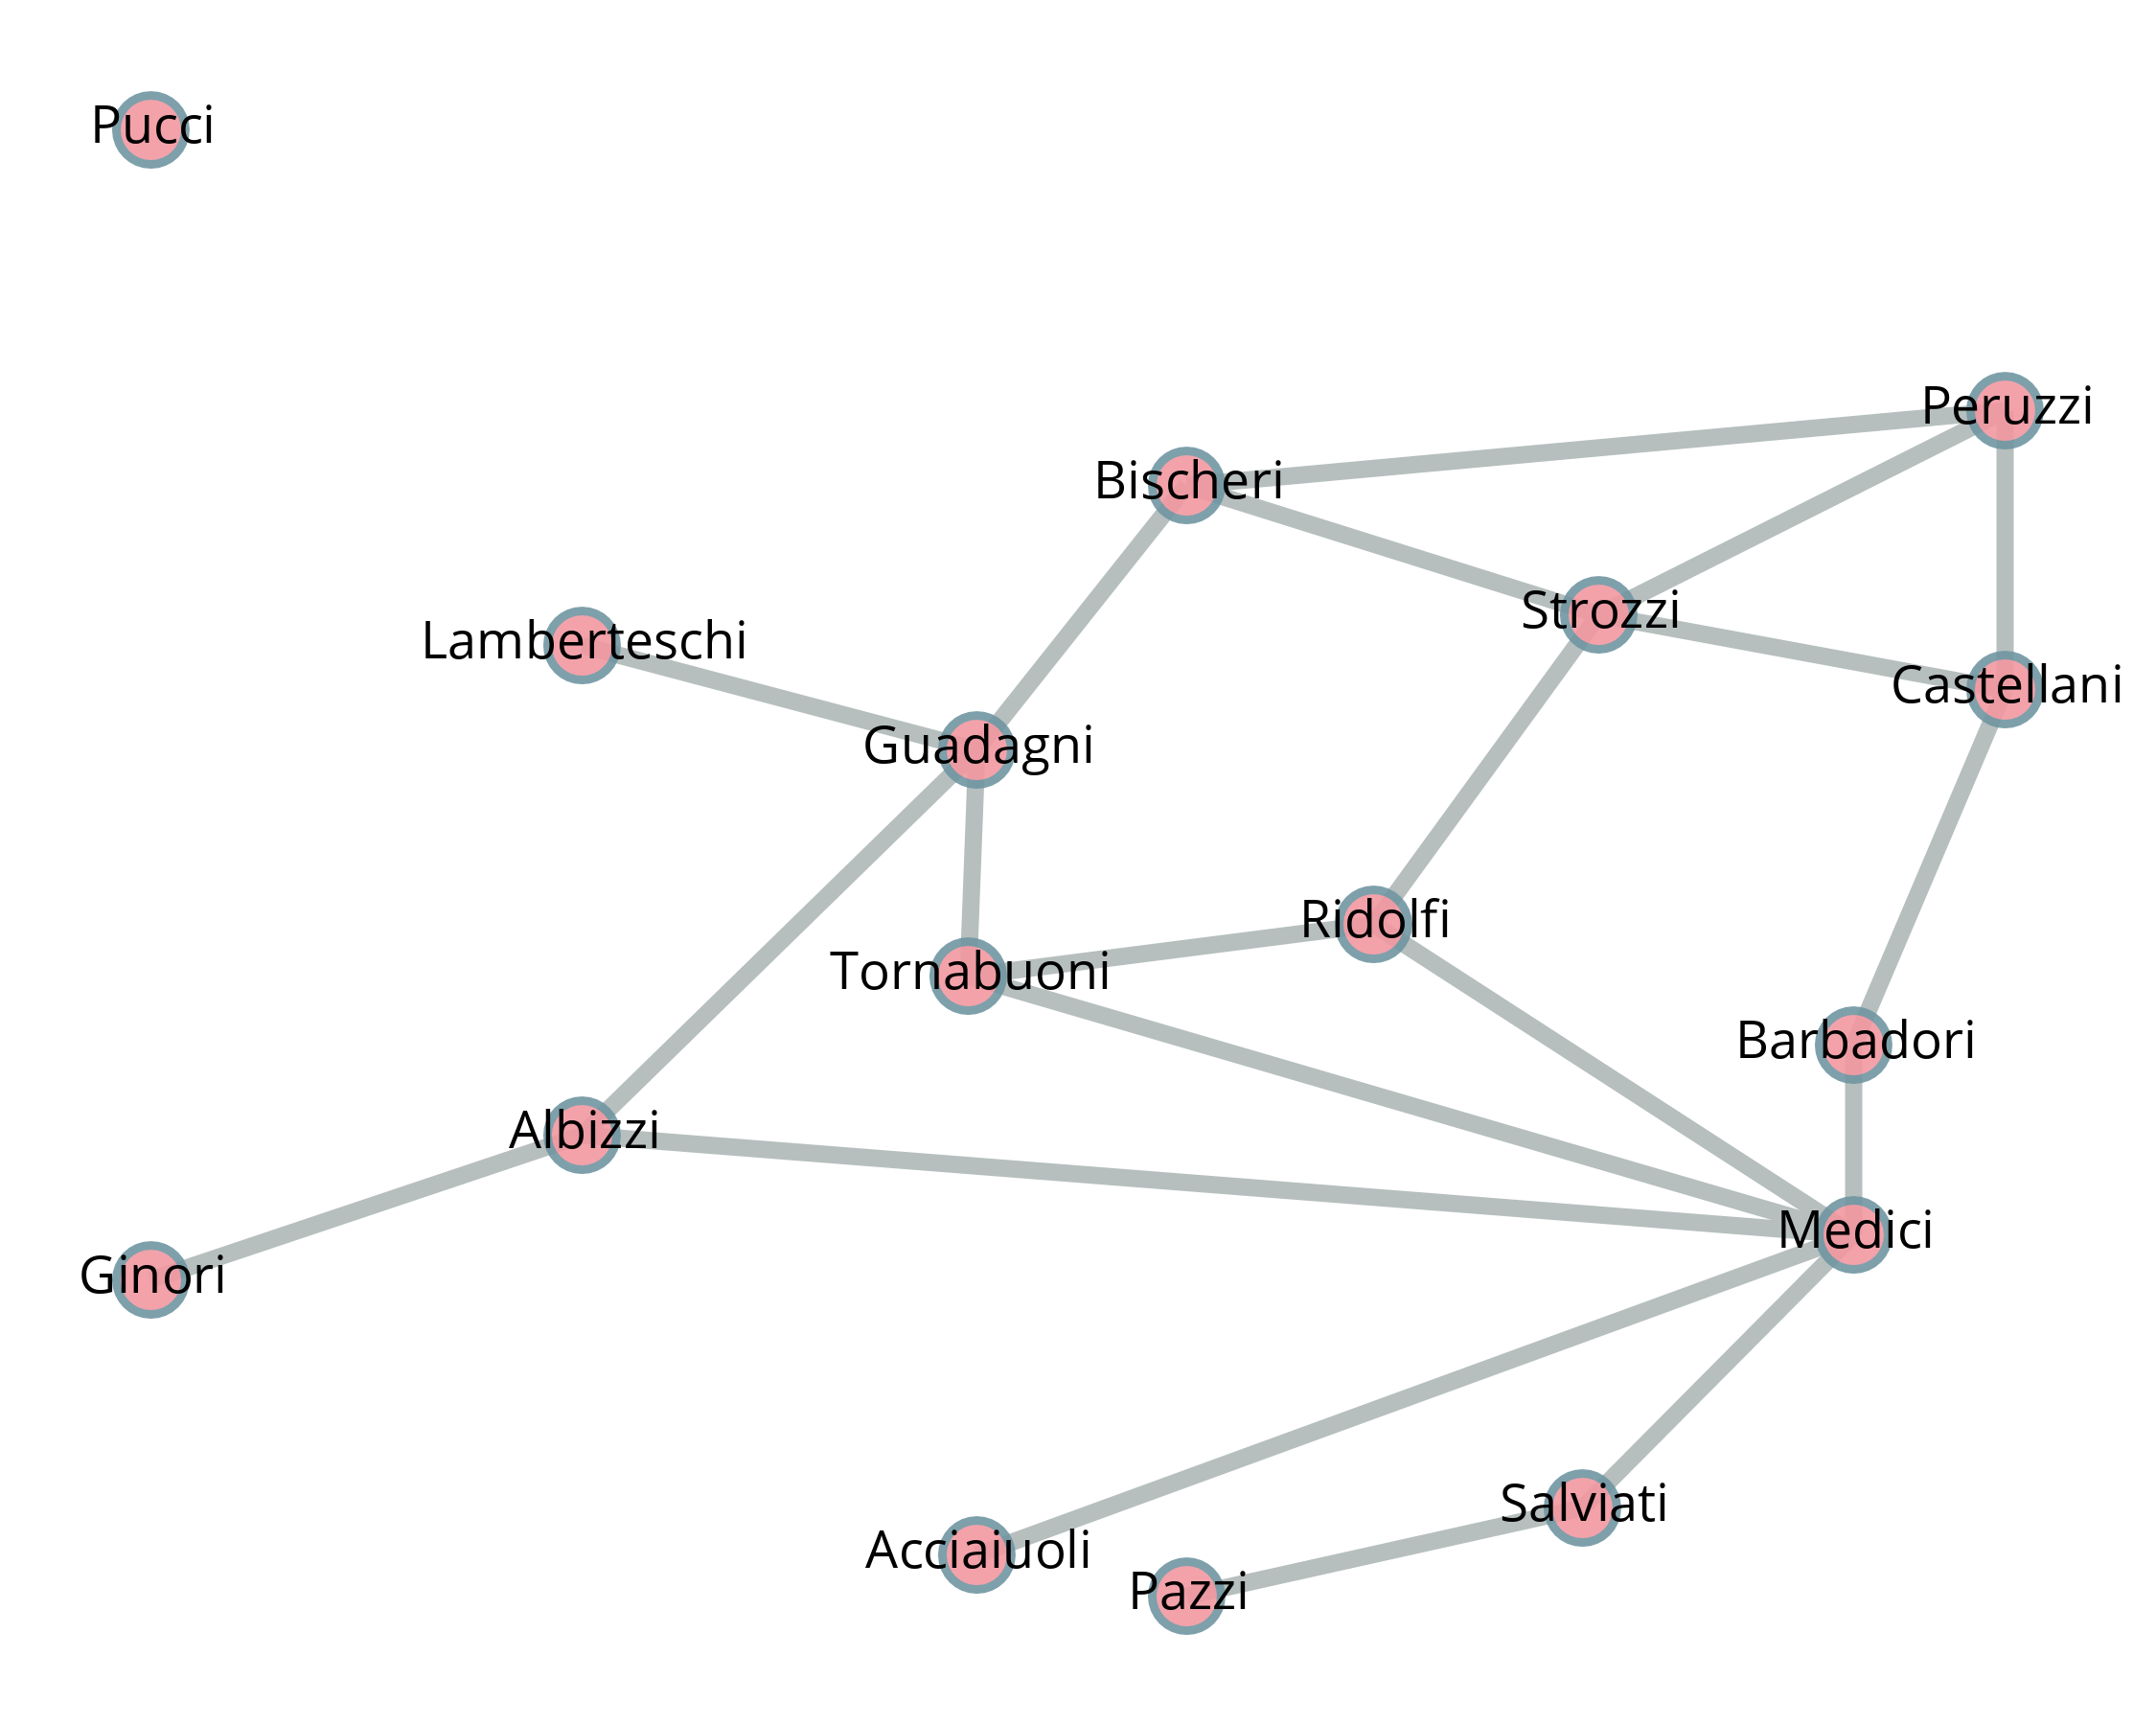 Directed networks need a bit more patience. Directed relationships are conventionally represented in social network diagrams using an arrow. On the downside, at the moment I haven’t found a way to use arrows in plotly. On the upside, the plotting script will indicate directionality with intensity-tapered-curved edges, a representation that is easier to interpret than arrows. On the downside (again), this method is much more computationally expensive. The parameter of interest here is the “gradient.” Each edge contains a number of small line plots equal to gradient. By default, these line plots go from wider, darker, and more opaque to thinner, lighter, and more transparent as they leave the source vertext and approach the target vertex. Setting the gradient parameter to a higher value will improve the quality of the visual results, though it will take longer to load in your browser; setting the gradient parameter to a lower value will do just the opposite. For the directed network, let’s look at Coleman’s (1964) high school interaction (“friendship”) network.
-
colemanplot = graph_plotly(colemangraph, yourplotlyname, yourplotlyAPIkey, vertexsize = 0.33, vertexopacity = .95, vertexborderopacity = 1, gradient = 150)
-
println(colemanplot[“url”]) #Find the plot at this URL
 Right now, the script has a few limitations. First, the graph coordinates must be saved as vertex attributes “x” and “y” and I’ve had to calculate these outside of Julia. Likewise, the vertices must be of type ExVertex, as the type KeyVertex cannot store attributes. Second, curved edges for undirected graphs have not yet been implemented. Lastly, I’m exploring different ideas to get the speed up for directed graphs. If anyone has any suggestions or feedback, I’d greatly appreciate it! Helper functions / Data / Plotting function